Distribution of 12 month forward total return for U.S. High Yield, when starting yields were between 8% and 9%
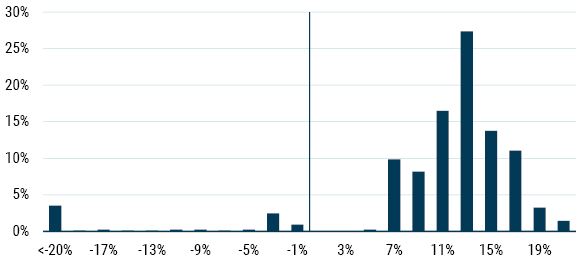
Data from August 1998 to May 2022 | Source: Bloomberg U.S. High Yield index
The negative return scenarios are all from 2007-2008.
The yield of the U.S. high yield (HY) market, currently at 8.4%, 1 has risen by over 420 basis points since the start of the year. In the 30-year history of the asset class, there have been only two other instances in which yields have doubled so quickly: in the depths of the Global Financial Crisis in 2008 and when the Covid-19 pandemic upended global markets in 2020.
For context, today’s yield is in the 62nd percentile of its historical wides, and in the 73rd percentile since the GFC. Meaning that the market has cheapened very quickly, but despite the pain, it’s still in middling territory relative to the yields we’ve seen over the long term.
This misses a crucial point about fixed income – for a high carry asset class like HY, even average yields on a historical basis require significantly poor forward outcomes to generate negative returns. Essentially, a higher yield means a higher breakeven against both credit and mark-to-market losses. A market at 8% yield, for example, can offset the bad outcomes significantly better than a market at 4% yield.
Putting this in actual terms, assuming a 30% recovery rate, an 8.4% annual yield can absorb a default rate of 12% in the subsequent 12 months. For comparison, over the past year the realized par default rate has been under 1%. While that’s likely to go up over the coming months, reaching a double-digit default rate that quickly would require a sizable credit shock.
The more immediate risk to HY is from market moves. Yields could certainly rise further – prior post-GFC peaks have been 200-300 bps wider than current valuations. But the carry available today provides a sizable cushion against that potential widening. Ignoring the benefit of rolldown, yields would need to rise by almost 100 bps in the next 6 months or by over 195 bps in the next 12 months before an investment would be under water.
Even incorporating some increased credit losses, there’s room for yields to cheapen further. Say the par default rate was to rise to 3% over the next year (from the current 12-month rate of 0.57%). In that scenario, yields could increase by 148 bps before HY starts incurring negative returns.
All this to say that allocations to U.S. HY look much more compelling today than they did just a few months ago. As the chart shows, historical evidence suggests that an 8.5% yield pays for the risk of a substantial set of bad outcomes while offering a favorable forward-looking risk/reward profile.
Download article here.
As of 6/13/2022.
Disclaimer: The views expressed are the views of Rachna Ramachandran through June 2022 and are subject to change at any time based on market and other conditions. This is not an offer or solicitation for the purchase or sale of any security and should not be construed as such. References to specific securities and issuers are for illustrative purposes only and are not intended to be, and should not be interpreted as, recommendations to purchase or sell such securities.
Copyright © 2022 by GMO LLC. All rights reserved.
As of 6/13/2022.