After a decade of consistent outperformance, Japanese small caps began underperforming their large cap peers in 2018, a trend that has accelerated since 2023. In fact, Japanese small caps have underperformed the broad Japanese market by 38% since 2018, 1 including 18.5% of underperformance since the beginning of 2023 (Exhibit 1).
EXHIBIT 1: JAPAN SMALL CAP vs. JAPAN
Relative Performance
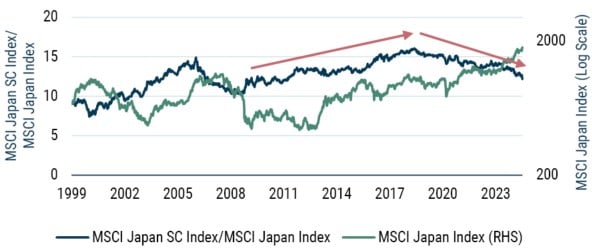
Data from 1/2/1999 through 7/6/2024 | Source: Bloomberg
We have spent considerable time trying to understand the reasons for this marked shift in relative performance. We have also worked to determine how likely it is for Japanese small caps to revert to their long-term outperforming trend. While small cap fundamentals will play a central role in developments from here, several other factors – mentioned below – will also be important. In combination, we see many reasons to expect they may ignite a new period of outperformance for small caps.
- Forex: Rapid yen depreciation since 2021 boosted overseas income in yen terms significantly, favoring large cap EPS growth over this period. However, the yen is as undervalued as it has been in decades and the widening interest rate differential that has caused it to weaken seems likely to narrow.
- Real wage growth: In 2018, real wages hit a peak of 1.1% and have fallen into negative territory ever since. Because small caps derive 80% of sales domestically versus large caps at less than 50%, they suffer when domestic buying power declines. However, labor and management agreed to 5.1% wage hikes in April, the highest since 1991, and real wages turned positive on a monthly basis in June for the first time in over two years. We believe real wages are likely to continue to rise.
- Fund flows: The BOJ began buying ETFs in 2010. It started slowly and reached a peak in 2018, when it purchased ¥6.3 trillion in total. These purchases were focused on indices such as Nikkei 225 and TOPIX 400, giving larger stocks the advantage. However, fund flows have changed drastically: the BOJ has stopped its ETF purchases. Moreover, individuals, long sellers of Japanese stocks, have stepped in as new buyers since January 2024 thanks to tax incentives to invest in NISA retirement accounts. Individuals, known for their affinity for small caps, are on track to buy ¥6.4 trillion of domestic stocks in 2024, which is similar to the annual level of BOJ purchases during Abenomics.
- Corporate governance: Large caps have improved their corporate governance faster than small caps, taking measures like bringing on independent directors. However, regulators have turned their attention to the small caps, urging them to manage toward higher returns and valuations.
Digging into the Variables
Fundamentals
Because the intrinsic value of stocks represents the discounted value of future cash flows, a weakening in the relative fundamental earnings power of small versus large caps would warrant their underperformance. Analysis shows, however, that fundamentals provide minimal explanation for small cap underperformance after 2018, with multiple compression playing the bigger role. The key fundamental divergence was in EPS growth from 2023, and it seems the weak yen — which favored large caps with higher levels of overseas sales — was the cause.
Since 2018, small caps showed marginally higher ROE and margin growth, however EPS growth began trailing large caps in May of 2023 (Exhibit 2). 2 Until then, small cap fundamentals had kept pace with large caps, suggesting that fundamentals were not behind the underperformance of small caps from 2018 to 2023.
EXHIBIT 2: KEY FUNDAMENTALS
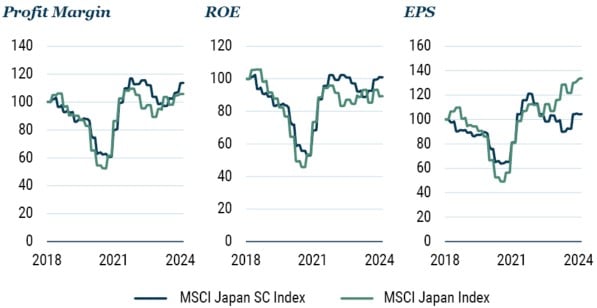
Data from 5/31/2018 through 7/23/2024 | Source: Bloomberg
Profit Margin, ROE, and EPS are indexed to 5/31/2018.
Sales growth, not margin expansion, drove the outperformance of large cap EPS growth after 2023. Actually, small cap sales growth had begun to flag in 2022, but small cap relative margins increased at the same time, helping small cap EPS keep pace with large caps. However, the continued decline in sales caused EPS to begin underperforming from 2023. A closer look at this suggests that yen weakness was behind sales weakness from 2022. Exhibit 3 shows the yen (on an inverse scale) against the spread in sales growth between small caps and large caps. Relative small cap sales growth suffered in lockstep with the depreciating yen after 2021.
EXHIBIT 3: MSCI JAPAN SC – MSCI Japan VS. JPY
Relative Sales Growth
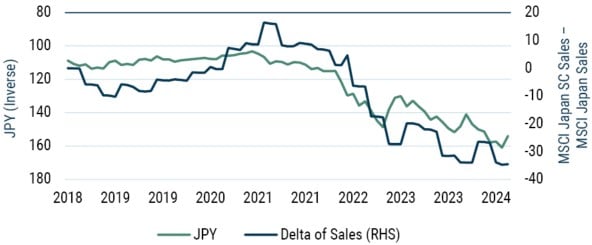
Data from 5/31/2018 through 7/24/2024 | Source: Bloomberg
Delta of Sales indexed to 5/31/2018
Large caps outperform during times of yen weakness because they have more international sales, which grow in yen terms when the yen weakens. The TOPIX index has an overseas sales ratio of 41%. While 52% of sales of the TOPIX 100 is from overseas, only 34% of the TOPIX mid-400 and 20% of TOPIX small cap sales come from overseas. 3 Companies with localized cost bases benefit from the currency translation of profits. Companies exporting goods from Japan benefit from additional margin expansion because some inputs, such as labor and capital, are denominated in yen. In this way, the yen is linked with the fundamental performance of Japanese companies.
Looking forward, we wouldn’t extrapolate continued yen weakening into the future. We don’t have a strong view on the currency, but we note that from a purchasing power parity perspective the yen is as weak as it has ever been, at least since 1970. 4 In addition, with domestic inflation in Japan pushing up and inflation in the U.S. plateauing, one can imagine a scenario where the interest rate differential begins to tighten, creating some respite for the yen. Additionally, political pressure for a stronger yen is building in Japan and the United States. We would expect a plateauing of the yen to ease small cap headwinds and strengthening to create a tailwind.
Relative Valuations
Although inferior EPS growth from 2022 was a drag on small cap performance, multiple compression is apparent from the time small caps began underperforming in 2018. As a result, Japanese small caps are trading at the largest discounts to their large cap peers over the past decade (Exhibit 4). The MSCI Japan Small Cap Index is trading on a P/E of 13.5x compared to the MSCI Japan Index P/E of 15.4x. The spread of -1.9x is the largest since 2010. Small caps are trading at a P/B of 1.1x compared to large caps at 1.6x. The -0.5x spread is the largest going back to 2007. Small cap dividend yields exceed those of large caps by 0.5%, a level unseen since 2001. From a relative and absolute value perspective, small caps are looking extremely attractive. (At some point, valuation matters!)
EXHIBIT 4: RELATIVE VALUATIONS
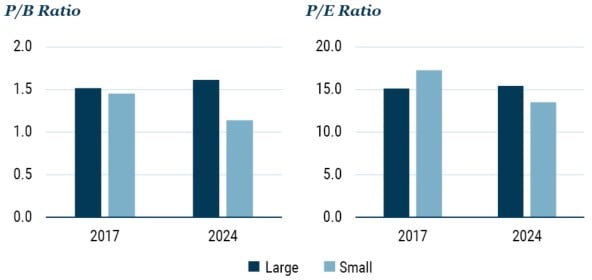
Data as of 9/30/2017 and 6/30/2024 | Source: Bloomberg
Large is represented by MSCI Japan Index; small is represented by MSCI Japan Small Cap Index.
While the yen may have been chiefly responsible for fundamental underperformance of small caps since 2021, valuation compression has been a bigger factor in their underperformance. We believe there were three key factors that drove multiple compression from 2018: real wage growth, fund flows, and corporate governance.
Real Wage Growth
Small cap relative performance shows a strong correlation with real wage growth over time. Because small caps are oriented more domestically than large caps, they benefit more from higher consumer purchasing power, which comes from higher wages. In addition, their margins are more impacted by domestic inflation than large caps, since sales are more exposed to Japan – a market in which it has been, until recently, famously difficult to pass on higher costs. Real wage growth hit a recent high of 1.1% in 2018 and has declined into negative territory since then, largely due to the spike in inflation after Covid. Over the same period, small cap relative performance has been notably weak. However, on a monthly basis, real wage growth broke into positive territory in June for the first time in over two years with a reading of +1.1%.
The outlook for significant real wage increases is good. While real wages have only recently turned positive on a monthly basis, there is reason to believe they will continue to rise as nominal wages increase and inflation moderates. First, nominal wages have turned up to 4.5% in the June reading, reflecting wage increases agreed to at the April Labor negotiation. The negotiations resulted in wage increases of 5.1% overall and 4.5% for small companies (Exhibit 5). In addition, it seems likely that CPI will moderate. The recent increase in CPI is due to the lifting of electricity and gas subsidies. Underlying CPI continues to moderate, however, and as the base effect of the subsidy removal declines, so should overall CPI.
EXHIBIT 5: Real Wage Growth
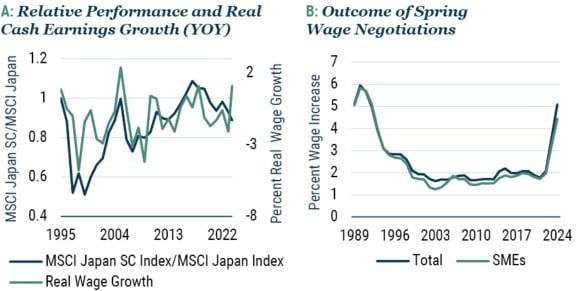
A: Data from 12/29/1995 through 8/21/2024 | Source: Bloomberg
B: Data from 1989 through 2024 | Source: Japan Trade Union Confederation
SMEs are companies with fewer than 300 employees.
Fund Flows
Fund flows of Japanese equities have gone through considerable structural changes over the past 25 years and have undoubtedly played a large role in the performance of equities and the relative performance of large and small cap stocks. The most striking observation is that Japanese individuals have been sellers of Japanese stocks over this entire period. Overseas investors were buyers through mid-2015 and then turned to net sellers until 2023 (Exhibit 6). Market performance overall aligned well with overseas net inflows during the Koizumi Rally from 2003 to 2006, when overseas net investment totaled ¥35 trillion, and then again during Abenomics from 2013 to mid-2015, when overseas investors bought up another ¥25 trillion. After Abenomics, however, overseas investors became consistent net sellers until 2023 and individuals continued to sell equities as well. Why, then, did equities continue to rally?
EXHIBIT 6: JAPANESE EQUITY FUND FLOWS VS. MSCI JAPAN
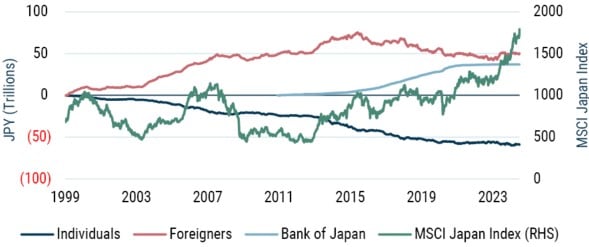
Data from 1/2/1999 through 7/6/2024 | Source: TSE, OSE, BOJ, Bloomberg
The answer is that the BOJ has stepped in as a new major source of demand for Japanese equities, beginning a program of ETF purchases in 2010 as a form of monetary easing. As of February 2024, the BOJ had purchased ¥37 trillion of Japanese equities, which had unrealized gains of ¥35 trillion 5 and a total value of ¥72 trillion. 6 Unlike overseas and individual investors, the BOJ was not in the business of picking stocks. Instead, it bought ETFs. In Exhibit 7, it is easy to see the impact of the BOJ on ETFs, which were quite small until their assets began to steadily grow in 2013. Today, domestic ETFs have Japanese equity holdings of roughly ¥89 trillion or 9.6% of the value of the TOPIX index, ¥72 trillion or 7.7% of which is owned by the BOJ.
EXHIBIT 7: ETFS IN JAPAN
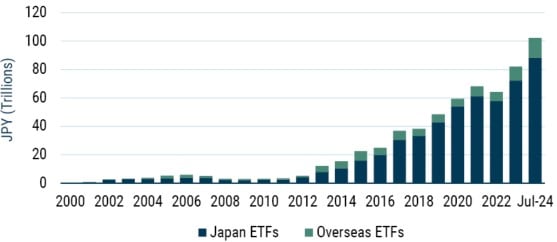
Data from 2000 through 7/1/2024 | Source: Bloomberg
Japan ETFs are ETFs domiciled in Japan that invest in Japanese equities. Overseas ETFs are ETFs domiciled outside of Japan that invest in Japanese equities.
While large fund flows are undoubtedly linked to the overall performance of Japanese equities, it is difficult to find a strong correlation between fund flows and small cap relative performance before 2018. However, we believe that around 2018 fund flows became an important driver of relative performance. In 2018, small caps began underperforming large caps just as overseas investors became strong net sellers and the BOJ became strong net buyers. It stands to reason that the dynamic after 2018 would have been more favorable to large caps than to small caps because BOJ bought ETFs composed of only the largest Japanese companies. The BOJ initially bought Nikkei 225 ETFs and later expanded to TOPIX 400 when it ramped up purchases during the Covid pandemic in 2020. Later, the BOJ began buying TOPIX ETFs due to concerns about market distortion. 7
EXHIBIT 8: FUND FLOWS AND SMALL CAP RELATIVE PERFORMANCE
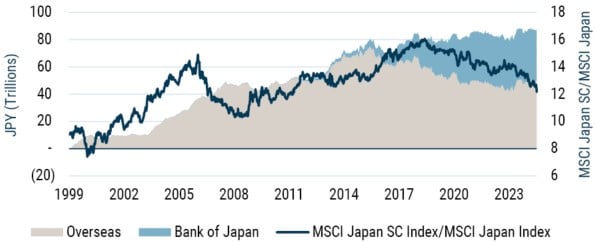
Data from 1999 through 7/6/2024 | Source: TSE, OSE, BOJ, and Bloomberg
Overseas refers to investors domiciled outside of Japan.
Fund flow dynamics seem to be at a new turning point. Whereas the BOJ began buying ETFs in 2010 to ease financial conditions, it tapered these purchases in 2021 and stopped them completely in October 2023 when inflation emerged, obviating the need for further financial easing. Overseas investors took the baton back, becoming net buyers in 2023. With the end of deflation in Japan, the BOJ’s purchases of ETFs have ended.
Perhaps the biggest change is that individual investors, net sellers for the past quarter century, could have a renewed interest in domestic stocks due to the NISA program. Japan revamped its NISA tax-free stock investment program for individuals on January 1, 2024. The reform reflects "the new form of capitalism" advocated by Prime Minister Kishida as he aims to double financial assets held by Japanese households, which kept about half of their ¥2.1 quadrillion (US$15 trillion) worth of assets in cash as of September 2023. 8 The new NISA program expands annual contribution limits by as much as threefold, doubles the lifetime contribution limit, and provides permanent tax exemption. In the first six months of 2024, the value of purchases in NISA was up about 4x, from ¥1.9 trillion to ¥7.5 trillion, an increase of ¥5.6 trillion. Within these NISA purchases, 42%, or ¥3.2 trillion, went to domestic stocks. 9 At an annualized rate of ¥6.4 trillion, inflows from domestic investors are already on par with BOJ inflows, which totaled ¥7.0 trillion in 2020, the highest annual amount the BOJ has ever purchased. 10 Unlike the BOJ, individual investors are known to have an affinity for small caps.
Corporate Governance Changes
There has been significant progress in modernizing Japan’s corporate governance over the past decade. While it is difficult to know the impact on stock prices with any accuracy, large caps have adopted these changes quicker than small caps, and such changes are clearly viewed positively by investors. Board structure provides some evidence of this: while large caps lead small caps in the percentage of independent directors by only about 7 percentage points (48% versus 41%), large caps lead small caps in terms of having a majority of independent directors by 18% (33% versus 15%), more than double the percentage of independent boards. In addition, the separation of duties between CEO and Chairman is far more progressed in large caps at 63% versus small caps at 18%. 11 In addition, larger companies have been more responsive to the Tokyo Stock Exchange (TSE) request to companies to disclose their plans to raise their ROE and share price (Exhibit 9).
EXHIBIT 9: CORPORATE GOVERNANCE CHANGES
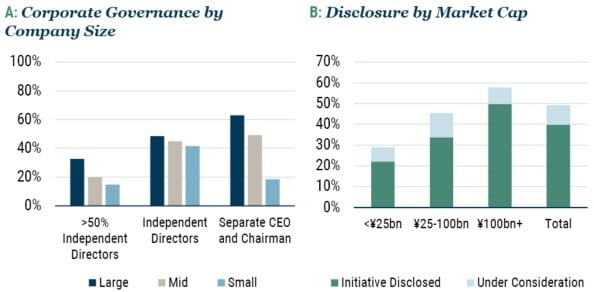
A: Data as of 7/2024 | Source: Bloomberg
B: Data as of 7/2024 | Source: J.P. Morgan
The governance headwind to small cap stocks could soon become a tailwind. First, TSE’s efforts have lately focused on pressuring small caps to improve. The recent directive for companies to disclose plans to raise P/B ratios and ROE were directed especially at those companies with P/B ratios of less than 1x and ROEs of less than 8%, which are overwhelmingly represented by small and mid-caps (Exhibit 10). In addition, small caps are likely to follow the prevailing corporate governance winds, but with a lag. There is an undeniable trend in corporate Japan for smaller companies to wait for larger companies to set new precedent before the small caps follow. A clear example would be how corporate governance initiatives are adopted within group companies — say an automotive OEM and its suppliers. The suppliers would be unlikely to make drastic reforms, especially unwinding holdings of the OEM, until the OEM had first adopted them.
Looking forward, it seems clear that corporate governance pressure from policymakers and activists should be a disproportionate tailwind for small caps.
EXHIBIT 10: LOW P/B COMPANIES BY SIZE
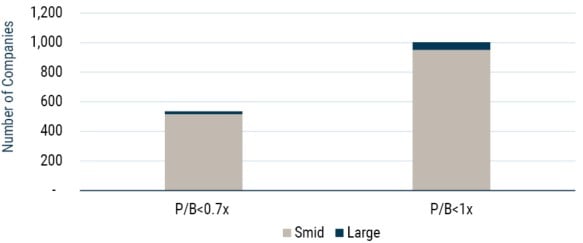
Data as of 7/20/24 | Source: Bloomberg
Smid and Large refer to companies with market caps <US$5bn and >US$5bn, respectively.
Outsized Alpha Opportunity in Japanese Small Caps
In addition to the solid outlook for small caps generally, we believe that the potential for alpha creation in the small cap universe of stocks is extremely attractive. These factors include the limited research coverage of small caps, the high level of activism among small caps and the ability to influence outcomes through engagement with these companies, their low liquidity, and TSE reforms that will shrink the small cap universe.
Research Advantage
The ranks of brokerage analysts covering Japanese small caps have dwindled over time. At the beginning of 2010, the average Japanese small cap stock was covered by 1.7 analysts. Even then, 56% of small caps were not covered at all. Today, the average small cap stock is covered by 0.9 analysts and 62% are not covered at all. While large and mid-caps have also seen a decrease in total coverage, the buy side plausibly has adequate information with, for example, mid-caps declining from 8 analysts to 5 (Exhibit 11). Declining from 1.7 to 0.9 arguably has a far greater impact on the information and analysis that investors can access. In addition, small caps are much less likely to release English language materials or have personnel who can interface with global investors in English, creating a high hurdle for most international investors. More than any time in the past 20 years, investors need to have robust local research and analytical capabilities to access Japanese small caps.
EXHIBIT 11: AVERAGE NUMBER OF ANALYST RECOMMENDATIONS
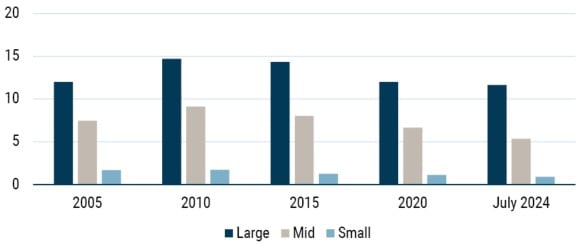
Source: Bloomberg
More Activism, More Consolidation
Most targets of activism in Japan are small caps, with 79% of activist events targeted at small cap companies (Exhibit 12). 12 Their small size makes it possible for activists to take a large position, their valuations are often very low, and there are often unutilized assets whose value activists can unlock through their strategies. The same applies to engagement-oriented investors, who are able to take a large position and influence management outcomes even without overtly activist tactics. As a result of activist pressure and the increasing normalization of M&A activity to rationalize industries, and, perhaps, the growing threat of delisting, small caps are overwhelmingly the targets of consolidation, being the object of 90% of takeover bids in 2023 and 100% in 2022.
EXHIBIT 12: NUMBER OF ACTIVIST EVENTS
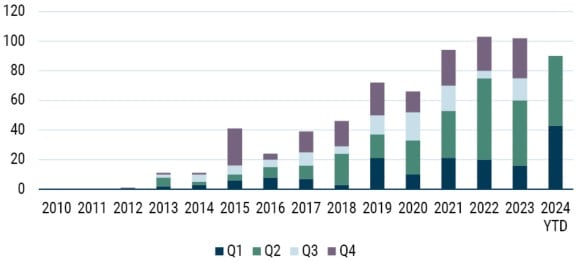
Source: Nicholas Smith, “AGMS: Expect More Upsets,” CLSA, June 7, 2024
Low Liquidity
Small caps cover a wide spectrum in terms of liquidity. Of the approximately 860 companies in the MSCI Japan Small Cap Index, 19% trade over US$10 million per day, 48% trade between US$2 million and US$10 million per day, and 33% trade less than US$2 million per day (Exhibit 13). A good part of the universe is suitable only for institutional investors with a relatively long-term horizon, raising the stakes on their fundamental research and adding a liquidity premium to the expected returns.
EXHIBIT 13: LIQUIDITY OF MSCI JAPAN SMALL CAP INDEX
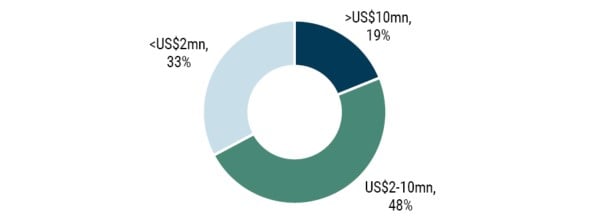
Date: 7/24/2024 | Source: Bloomberg
TOPIX Index Streamlining
In addition, the TSE is planning to reduce the number of companies in the TOPIX to create a higher quality index and increase a sense of competition for companies to be included. While the TOPIX currently has 2,136 members, that number will decrease to around 1,700 in January 2025 when companies with the lowest liquidity in terms of free-float market capitalization will be eliminated. The TOPIX is expected to shrink further to 1200 or so constituents by 2028. The criteria for inclusion in the index have not yet been made clear. Although the near-term exclusion of micro-cap stocks is not likely to impact most institutional small cap investors, the continued paring of the TOPIX could create dynamics that are important to navigate. First, some companies may try to make fundamental improvements to stay in the index. In addition, stock prices of some companies could fall as the market anticipates their exclusion from the TOPIX. In any case, this initiative creates a dynamic environment in the small cap universe with new risks and opportunities to create alpha.
Conclusions
It seems likely that a combination of factors including fundamentals (driven by yen depreciation), real wage growth, fund flows, and corporate governance initiatives all played a part in the underperformance of Japanese small cap equities relative to large caps since 2018. However, we believe changes to many of these variables are in their early stages and could mark a new trend of small cap outperformance:
- The yen is at a historically low valuation, and it seems unlikely that a further expansion in the yield spread between U.S. and Japanese interest rates will drive significant further yen depreciation.
- Real wages, which had been hit by soaring inflation and tepid nominal wage growth, appear positioned to turn up as inflation plateaus and large wage increases negotiated by labor and management take effect.
- Fund flows appear to be at a major turning point with the BOJ terminating its ETF purchasing program; overseas investors are showing interest in raising their underweight position in Japanese equities; and individual Japanese investors are turning to net buyers with the help of the new NISA program after years of selling domestic equities.
- Although small caps have lagged large caps in the adoption of better corporate governance, small caps have lately come into the crosshairs of activists and the TSE, with significant new pressures to raise their ROE and valuations through better corporate governance.
While these new tailwinds would help small caps across the board, we continue to believe there is a significant opportunity to add alpha in small cap selection. After underperforming for eight years, small caps are under-covered and out of favor, creating opportunity for those who have continued to cover them through good times and bad. Beyond varying levels of quality, the liquidity profiles of small caps run a wide gamut, often requiring patient capital. The split between the winners and the losers is likely to be magnified as more, but not all, small caps follow the market leaders and adopt stronger governance measures.
Download article here.
Total return, 12/29/2017 through 6/29/2024 (Bloomberg).
For this analysis, “small cap” refers to the MSCI Japan Small Cap index and “large cap” refers to the MSCI Japan index.
J.P. Morgan
Bloomberg
Bank of Japan
Nomura, “The Complicated History of the BOJ's ETF Purchases and Previous Instances of Exits,” Kitaoka (May, 2024).
For more discussion on the impact of passive investing on small caps, see GMO’s latest Quarterly Letter, FAQ: Passive Investing (Inker and Pease 2024).
“Revamped NISA Program Launched to Spur Investment Wave in Japan,” Japan Times (January 2024). “Tax-Free Account Boom Heralds New Wave of Young Japan Investors,” Bloomberg (November 2023).
Most of the remainder went to investment trusts focused on global equities.
Bank of Japan
In this analysis, small, mid, and large caps are defined as market cap <US$2bn, US$2-5bn, and >US$10bn, respectively (Bloomberg).
IR Japan
Disclaimer: The views expressed are the views of Drew Edwards, Colin Bekemeyer, and the GMO Usonian Japan Equity team through the period ending September 2024 and are subject to change at any time based on market and other conditions. This is not an offer or solicitation for the purchase or sale of any security and should not be construed as such. References to specific securities and issuers are for illustrative purposes only and are not intended to be, and should not be interpreted as, recommendations to purchase or sell such securities.
Copyright © 2024 by GMO LLC. All rights reserved.
Total return, 12/29/2017 through 6/29/2024 (Bloomberg).
For this analysis, “small cap” refers to the MSCI Japan Small Cap index and “large cap” refers to the MSCI Japan index.
J.P. Morgan
Bloomberg
Bank of Japan
Nomura, “The Complicated History of the BOJ's ETF Purchases and Previous Instances of Exits,” Kitaoka (May, 2024).
For more discussion on the impact of passive investing on small caps, see GMO’s latest Quarterly Letter, FAQ: Passive Investing (Inker and Pease 2024).
“Revamped NISA Program Launched to Spur Investment Wave in Japan,” Japan Times (January 2024). “Tax-Free Account Boom Heralds New Wave of Young Japan Investors,” Bloomberg (November 2023).
Most of the remainder went to investment trusts focused on global equities.
Bank of Japan
In this analysis, small, mid, and large caps are defined as market cap <US$2bn, US$2-5bn, and >US$10bn, respectively (Bloomberg).
IR Japan