Asset Allocation Is Easy in Theory, Difficult in Practice
In theory, growing a pool of wealth over decades – whether for a family, an endowment, or a pensioner – is a straightforward endeavor. An advisor or allocator needs to do three things: understand the goals of their client, find different ways to receive compensation for taking risks, 1 and then take the right amount of risk to meet those goals. 2 Taking too much risk may expose the client to unacceptable drawdowns, while taking too little risk will likely lead to inadequate returns in the long run.
The de facto “passive” allocation of 60% equities/40% bonds has proven effective at compounding wealth over time by tapping into two key risk premia: the equity risk premium earned by underwriting the risk of an economic growth shock and an inflation risk premium received for bearing the risk of surprise inflation. Since 1979, when the Bloomberg U.S. Aggregate Index incepted, a 60/40 portfolio made up of U.S. equities and bonds has delivered returns of 10.2% annualized, outpacing inflation by 7.0% and exceeding the return requirements of most investors.
So, we’re done, right? We should all just run 60/40 allocations and call it a day? That approach has worked exceptionally well since 1979, and quite nicely over even longer time periods. While the classic disclaimer on investment ads says past performance is no indication of future results, we can take away some lessons from 120 years of results for a 60/40 portfolio. As Exhibit 1 indicates, a 60/40 portfolio (in this case U.S. stocks and U.S. bonds) has delivered real return of about 4.8% since 1900 – a couple of points less than the 1979-to-present period, but again sufficient for most investors’ needs.
But this enviable long track record hides the fact that there have been six periods, averaging 11 years each, in which an investor in a 60/40 portfolio would have either broken even relative to inflation or, even worse, lost money in real terms. Those chapters share something in common – they all followed exceptionally strong periods of return for the traditional portfolio and thus began when either or both stocks and bonds were trading at extremely high valuations.
Exhibit 1: 60/40 – “Lost Decades” Are More Common Than You Think
Most started with high valuations on stocks and/or bonds
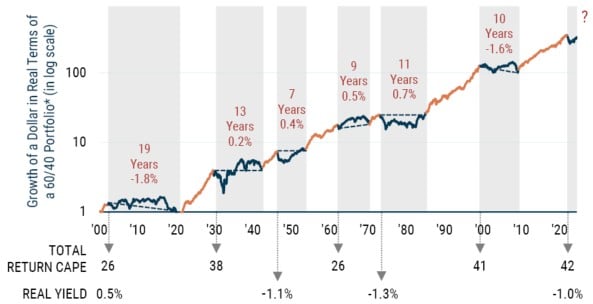
*60% U.S. Equities (S&P 500), 40% U.S. Bonds (U.S. Treasuries)
As of 6/30/2024 | 60% U.S. Equities (S&P 500), 40% U.S. Bonds (U.S. Treasuries) rebalanced monthly.
Sources: Bloomberg, Global Financial Data (early history), Factset (S&P500 returns and CPI), J.P. Morgan (J.P. Morgan GBI United States Traded), Shiller data, Federal Reserve Bank of Philadelphia (U.S. Treasury Yields and Long-term Inflation Expectations). Real yield is the yield on the 10-Year U.S. Treasury minus Philly Fed Long-Term Inflation Expectations (1992-present) or the 12-month trailing CPI (early history). Current CAPE = 31 and Real Yield = 1.0%.
In the most recent run up from early 2009 through the end of 2021, this passively allocated 60/40 portfolio delivered about 9.4% real, about twice the long-run average. These stellar returns were powered by rising equity markets and a decline in interest rates that left the S&P and real bond yields at some of their least attractive valuations in history. Today, following the fastest rate hike cycle in 30 years, real and nominal yields on government bonds look reasonable (though the inverted yield curve may make it hard for bonds to earn more than cash). But the yield pickup for taking most credit risk looks unsatisfactory and some stocks, particularly in the U.S., are trading at excessively high valuations. Against this backdrop, reversion toward longer term valuations would lead to very disappointing medium-term returns for a 60/40 portfolio.
Enhancing Traditional Stock/Bond Allocations
Investing in a static 60/40 allocation relies heavily on the herd’s view of valuation, or, more accurately, whatever way the wind of investor sentiment is blowing. The passively allocated 60% to equities buys more of whatever has the largest market cap, while the 40% invested in bonds leads to increased exposure to borrowers that issue more debt than others in the index. Even in an industry where “being different” can be a difficult, doesn’t it make sense to get a second opinion from someone who is prepared to genuinely look at valuations relative to underlying fundamentals?
Risk premia change as valuations change, so an asset allocation strategy should only hold assets that are priced to deliver satisfactory returns at any given time. Valuation-sensitive multi-asset class strategies such as GMO’s Benchmark Free Allocation Strategy (BFAS), which shifts allocations significantly during extreme valuation environments, can help a portfolio both avoid bubbles and capitalize on dislocations. The following examples of dynamically shifting and expanding beyond traditional risk premia are ways BFAS has been able to help diversify risks and enhance returns:
- Timing – Playing Defense: As valuations reached dizzying heights across all asset classes in 2007 and 2008, we reduced equity exposures in BFAS to 25%, solely allocated to quality stocks in the U.S., and preferred a position in a long quality/short junk strategy which protected in the GFC downturn. The defensive posture of BFAS helped protect capital during the GFC drawdown with BFAS falling 19.3% from the end of October 2007 through February 2009, while the 60/40 MSCI ACWI/Bloomberg U.S. Aggregate portfolio fell 35.7% in the same period. Importantly, as global equities bottomed down 55%, our valuation signals lit up green. Jeremy Grantham famously penned Reinvesting When Terrified in March 2009 as we were ramping up our equity exposure.
- Timing – Playing Offense: Another way to enhance asset allocation strategies is to use traditional assets in a less conventional way, perhaps through targeted or thematic strategies. For example, the equity market selloff induced by Covid lockdowns in early 2020 presented an opportunity to invest in the highest quality businesses in cyclical sectors that were hit particularly and, crucially, indiscriminately hard. Partly due to getting an excellent start because of the cheapness of those companies at the time, our allocation to GMO’s Quality Cyclicals Strategy delivered 221 bps of annualized alpha since its inception in early April 2020 through August 2024.
3
In a similar fashion, we currently believe that an exposure to Japan small cap value equity could prove very rewarding due to improving fundamentals and corporate reform efforts, favorable valuations, and an extremely cheap yen. A traditional 60/40 portfolio, holding about two thirds of its equity exposure in expensive U.S. equities, picks up little of this opportunity.
- Expanding the Toolkit: Finally, by expanding beyond traditional risk premia, investors can tap into other ways to get paid that help diversify risks and enhance returns. This could simply include broadening fixed income exposures to allow investments like high yield, emerging debt, structured/asset-backed securities, and Treasury Inflation Protected Securities (TIPS), or could also encompass the use of alternative risk premia. One example of an alternative approach would be an equity long/short strategy, such as our Equity Dislocation Strategy, which launched in late 2020 to generate returns from a narrowing of the valuation dislocation between cheap value stocks and egregiously expensive growth stocks. Driven by its risk-aware structure, an unwavering focus on the very cheapest and most expensive stocks, and strong stock selection, the strategy has generated a cumulative gross return of some 54.4% (41.2% net) as of August 2024. This has far outpaced an index approach of being long MSCI ACWI Value and short MSCI ACWI Growth, which rose a modest 4.0% over the same period, suggesting that much of the opportunity remains intact.
Identifying and accessing diversifying exposures can be challenging. An investor must not only detect valuation disparities across many asset classes and sub-asset classes, but must also be able to access products to capitalize on those opportunities. Another challenge lies with getting clients comfortable leaning into dislocations, which typically means buying into things that haven’t worked and/or betting against those that have been recent winners.
More Than Two Decades of Experience at Work
GMO’s BFAS is a valuation-sensitive strategy that dynamically allocates across and within multiple asset classes aiming to deliver positive returns over inflation and better risk-adjusted returns relative to a traditional 60/40 portfolio in the long run. By avoiding expensive assets and capitalizing on undervalued opportunities, BFAS has helped investors enhance risk-adjusted returns and navigate various market cycles with greater resilience since its inception in 2001 (Exhibit 2).
Exhibit 2: Valuation-Sensitive Investing Has Delivered Attractive Long-Term Results
Benchmark-Free Allocation Strategy has delivered solid risk-adjusted returns
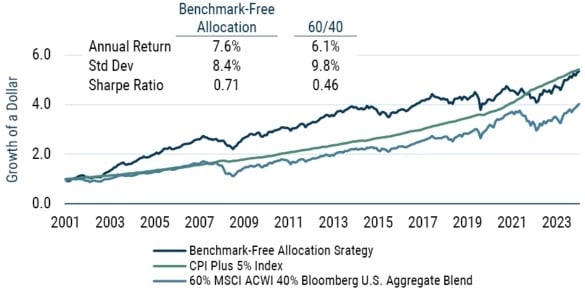
As of 8/31/2024 | Source: GMO
Inception 7/31/2001
The chart above shows the past performance of the Benchmark-Free Allocation Composite
(the “Composite”). Prior to January 1, 2012, the accounts in the Composite served as the principal component of a broader real return strategy. Beginning January 1, 2012, accounts in the composite have been managed as a standalone investment.
Given our valuation-sensitive philosophy, BFAS tends to trail in extended periods of elevated valuations while protecting capital in drawdowns. Because valuations often overshoot on the upside in strong bull markets, BFAS usually underperforms in the latter innings of these periods given the strategy typically reduces risk as valuations rise. The approach, though, has been particularly helpful when markets revert, especially during drawdowns of 10% or more for a 60/40 portfolio, as Exhibit 3 makes clear.
Exhibit 3: Valuation Sensitivity Helps in Most Drawdowns
BFAS has acted as a helpful diversifier in four of five last large 60/40 declines
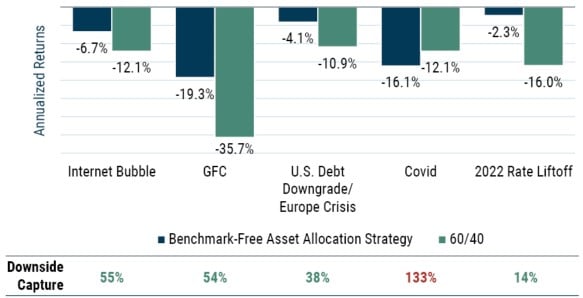
Source: GMO | Internet Bubble: 8/31/01 - 2/28/03; GFC: 5/31/07 - 2/27/09; U.S. Debt Downgrade: 4/29/11 – 9/30/11; Europe Crisis: 12/31/19 – 3/31/20; Covid: 5/31/21 – 9/30/22; 2022 Rate Liftoff: 12/31/21 – 12/31/22.
A Second Opinion Capitalizes on Today’s Investment Landscape
Today, a 60/40 portfolio is loaded with expensive U.S. growth equities and credit exposures offering narrow spreads over Treasuries. In our view, such a portfolio is likely to disappoint investors by delivering low single-digit real returns. The good news, however, is that a second opinion can identify and unlock compelling opportunities.
Despite strong gains in equity markets over the last 18 months with many indices at or near record highs, we are enthusiastic about the investing landscape. An abundance of assets ranging from fairly valued to downright cheap underpins this outlook from an absolute return standpoint, while appealing valuation spreads within asset classes present us with the best relative asset allocation opportunity we’ve seen in 35 years. By dialing into three current market dynamics, we are building portfolios with some of the highest forecasted relative and absolute returns we’ve ever seen:
- Non-U.S. equities are cheap relative to the U.S. and cheap currencies add a tailwind.
U.S. equities have delivered solid fundamental performance, in line with our long-term assumptions, but have also seen their multiples rise significantly in recent years. Across many valuation metrics, including CAPE ratios, the U.S. is trading at or near its largest premium ever relative to the rest of the world. For those who argue a CAPE ratio is somehow missing the fact that U.S. equities are massively better fundamentally than they were a decade ago, valuations on a price-to-forward earnings basis (which embeds forward-looking growth on top of today’s high earnings) look every bit as stretched with the U.S. trading at over a 50% premium to its long-run average.
Markets in the rest of the world, however, are trading at or below their long-run averages, creating a huge gap in relative valuations to the U.S. Not only do non-U.S. stocks benefit from attractive valuations, but they also stand to profit handsomely from cheap currencies. Equity investors can capture the benefit of cheap currencies in two ways: either the currencies can appreciate back toward fair value, or the companies can exploit the competitive advantage of lower relative costs to boost earnings growth. Japan small value equities are particularly compelling today, driven by their absolute and relative cheapness, the underlying secular changes in corporate governance and profitability, and a record cheap currency. - Deep value is extremely dislocated.
The cheapest 20% of markets, which we refer to as deep value, is severely dislocated, trading at 6th and 1st percentile discounts compared to history in the U.S. and developed ex-U.S. markets, respectively. 4 Value, especially its cheapest cohort, offers outperformance through two channels: the discount the group trades normalizes, and/or cheaper stocks benefit from what we call rebalancing. Rebalancing stems from the fact that value is not a static strategy. Cheap companies as a group don’t grow as fast as the average company, but some of them wind up positively surprising investors. As the better-than-expected results and outlook cause investors to look more favorably at those companies, their valuations rise even if the rest of the value group continues trading at a large discount. Such stocks wind up leaving the value universe, but they perform very well on their way out. At the same time, other companies that were expensive and in the growth universe disappoint investors and see their valuations fall. Such stocks, originally in the growth universe, see quite poor returns but give a fresh source of newly cheap companies upon entering the value universe, replacing those value companies whose positive surprises led to upward revaluations. The rotation of cheap companies entering the value group as the relatively more expensive stocks exit provides a meaningful tailwind to relative returns, even in an environment where the overall spread between growth and value stock valuations remains the same. Importantly, the wider the value spread (like we see today), the more impactful rebalancing tends to be.
We are leaning heavily into this compelling opportunity across our portfolios through our long-only U.S. Opportunistic Value and International Opportunistic Value strategies. Thanks to the robust opportunity set for deep value, a holistic view of value, and thoughtful portfolio construction constraints, both U.S. and International Opportunistic Value trade significantly cheaper than broad value benchmarks, but are of higher quality when viewed through the lens of debt-to-equity and ROE metrics. - The historically wide spread between value and growth sets up a compelling long/short opportunity.
Of course, deep value is not the only group that is dislocated. Growth broadly is trading expensively relative to its history. In fact, the most richly priced 20% of markets (i.e., extreme growth) is trading at 89th and 93rd percentile premiums compared to history in the U.S. and developed ex-U.S. markets, respectively. 5 The spread between the extreme growth and deep value cohorts is excessively wide today, creating an opportunity for a long/short strategy to benefit should relative valuations narrow.
GMO’s Equity Dislocation, a strategy which is 100% deep value and 100% short extreme growth stocks (and the largest single exposure within BFAS), seeks to benefit from this aberration. As Exhibit 4 indicates, there is a huge gap in the characteristics between our longs and our shorts. Our long portfolio is trading at somewhere between one third and one fifth the valuation of the short portfolio.
Exhibit 4: Equity Dislocation Strategy
Leveraging the wide gap between value and growth to deliver diversifying returns
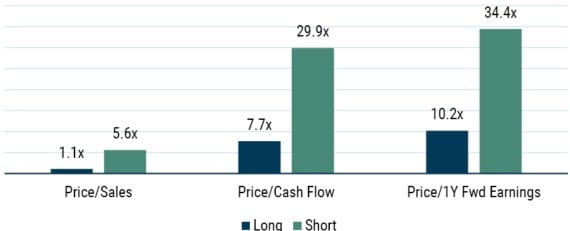
As of 8/31/2024 | Source: GMO
Portfolio characteristics are subject to change. The above information is based on a representative account in the strategy selected because it has the fewest restrictions and best represents the implementation of the strategy.
As in the case of value, spread narrowing isn’t the only way a long/short strategy can win. Such a strategy benefits from both sides of the rebalancing process described above by being long value stocks that leave the universe with higher valuations than they entered it with, and shorting growth stocks that disappoint. If growth stocks are trading at huge premiums and fail to meet the lofty expectations priced into them, their valuations get slammed. 6
Identifying an attractive investment opportunity is only half the challenge – execution to capitalize on it is also critical. At GMO, we have a long history of building new strategies to rotate portfolios to the most compelling return sources on offer. Today, over 50% of what BFAS holds didn’t exist four years ago. GMO’s Asset Allocation team identified compelling opportunities and leveraged GMO’s infrastructure and underlying investment teams to build portfolios to capitalize on the specific themes.
Exhibit 5: GMO’s Benchmark-Free Allocation Strategy
New strategies since 2020
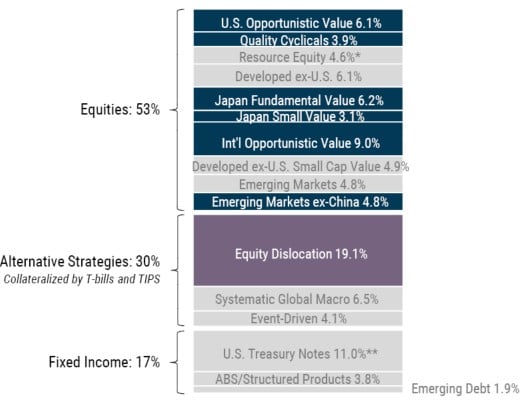
As of 8/31/2024 | Source: GMO
*Includes GMO’s Resources and Climate Change strategies
**The headline exposure to U.S. Treasury Notes should not be considered in isolation of the portfolio’s overall duration profile inclusive of collateral and other exposures.
The above information is based on a representative account in the strategy selected because it has the fewest restrictions and best represents the implementation of the strategy. Weightings are as of the date indicated and are subject to change. The groups indicated above represent exposures determined pursuant to proprietary methodologies and are subject to change over time. Totals may vary due to rounding.
Echoes of the Past as We Look Ahead
In many ways, the investment landscape today looks eerily similar to 1999, when we first began talking to clients about the portfolio concept that became the Benchmark-Free Allocation Strategy. At that time, the 60/40 portfolio had just come off 14 years of making 11.4% nominal (8% over inflation) per annum, the S&P 500 was trouncing both small caps and international indices, and valuations for growth stocks were higher than anything seen in history.
At the time we believed that a traditional 60/40 portfolio was priced to deliver about 2% real over the next decade, far below the level investors seek for the long run. We did, however, note that not everything was overpriced and there were ways to earn decent returns. Indeed, there were a lot of attractively priced assets back then, but to have an overall portfolio with a decent expected return, what you needed to be willing to own didn't look much like the traditional 60/40. Back in 1999, if you were willing to take the risk of looking different, we thought the return for doing so was incredibly high.
That is what we see again today. It's another time when the 60/40 has done very well for a long period of time. It's another time when the S&P 500 and particularly growth stocks have been the assets to beat for a long time. The outperformance of U.S. over non-U.S. stocks and growth over value, as well as the narrowing of credit spreads, has left us in a position where we still find many assets worth owning, but taking advantage of those opportunities requires a willingness to look quite different than a standard, capitalization-weighted 60/40 portfolio.
Today, we believe that leaning away from expensive U.S. growth stocks and very tight credit assets into attractively priced non-U.S. stocks and value will help generate higher compounded returns than a traditional passive portfolio. Through its valuation-sensitive approach, the GMO Benchmark-Free Allocation Strategy has historically acted as a helpful diversifier to traditional portfolios with risk concentrated primarily in market-cap based equity exposures. BFAS provides a way for investors to incorporate some of this thinking into their existing strategic allocations and is widely available across financial advisor platforms with no minimums required.
Download article here.
In the long run, earning sustainably high returns will require taking risks that counterparties are willing to pay to avoid. If an asset or strategy gives a return that does not have some unpleasant characteristics to it, it is unlikely to deliver substantial returns in the long run. A substantial part of the art of building portfolios for investors is determining what risks the investor is in a position to take on that counterparties are willing to pay for.
The goals for a client include both their goals for returns and their willingness to take risk in service of those return goals. A client who says they need to earn 10% per year and cannot tolerate any losses has demonstrated that their goals are not mutually compatible, and asset allocation will not be able to fix that. Ensuring that a client’s goals are feasible is a necessary precursor to building an appropriate portfolio for that client.
Quality Cyclicals returned 20.63% (net), outperforming the MSCI ACWI return of 18.42% by 221 bps for the period 4/3/2020 through 8/31/2024.
As of 8/31/2024.
As of 8/31/2024.
The effective number of names in the S&P 500 Index is lower than it has been in more than 50 years. A long/short portfolio offers another compelling attribute in today’s highly concentrated market dominated by a handful of mega cap stocks. In a long/short portfolio, we are aiming to capture the narrowing of the spread between two groups rather than taking idiosyncratic stock bets and can thus afford to be much more equally weighted.
Disclaimer: The views expressed are the views of Ben Inker through the period ending September 2024 and are subject to change at any time based on market and other conditions. This is not an offer or solicitation for the purchase or sale of any security and should not be construed as such. References to specific securities and issuers are for illustrative purposes only and are not intended to be, and should not be interpreted as, recommendations to purchase or sell such securities. Past performance is no guarantee of future results.
Copyright © 2024 by GMO LLC. All rights reserved.
In the long run, earning sustainably high returns will require taking risks that counterparties are willing to pay to avoid. If an asset or strategy gives a return that does not have some unpleasant characteristics to it, it is unlikely to deliver substantial returns in the long run. A substantial part of the art of building portfolios for investors is determining what risks the investor is in a position to take on that counterparties are willing to pay for.
The goals for a client include both their goals for returns and their willingness to take risk in service of those return goals. A client who says they need to earn 10% per year and cannot tolerate any losses has demonstrated that their goals are not mutually compatible, and asset allocation will not be able to fix that. Ensuring that a client’s goals are feasible is a necessary precursor to building an appropriate portfolio for that client.
Quality Cyclicals returned 20.63% (net), outperforming the MSCI ACWI return of 18.42% by 221 bps for the period 4/3/2020 through 8/31/2024.
As of 8/31/2024.
As of 8/31/2024.
The effective number of names in the S&P 500 Index is lower than it has been in more than 50 years. A long/short portfolio offers another compelling attribute in today’s highly concentrated market dominated by a handful of mega cap stocks. In a long/short portfolio, we are aiming to capture the narrowing of the spread between two groups rather than taking idiosyncratic stock bets and can thus afford to be much more equally weighted.