Executive Summary
Despite substantial growth and huge advancements in public policy support, clean energy has had an abysmal stretch in the stock market the last two and a half years. In this paper, we will discuss some of the factors that have led to this discrepancy, how we approach investing in this tricky sector, and why we are so optimistic about the outlook for clean energy going forward.
The drop
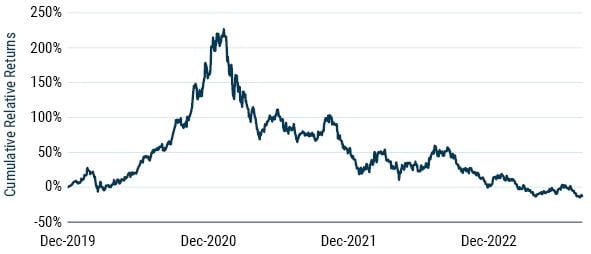
Clean energy over the last few years looks suspiciously like one of Jeremy Grantham’s bubbles (see Exhibit 1). After outperforming the MSCI All Country World Index (ACWI) by more than 200% over 2020 and the beginning of 2021, the Wilderhill Clean Energy Index lost all that alpha and then some through the end of last month, as it dropped over 70% in absolute terms from its February 2021 peak.
Exhibit 1: Wilderhill Clean Energy Index vs. MSCI ACWI
As of 8/31/2023 | Source: MSCI, WilderShares, GMO
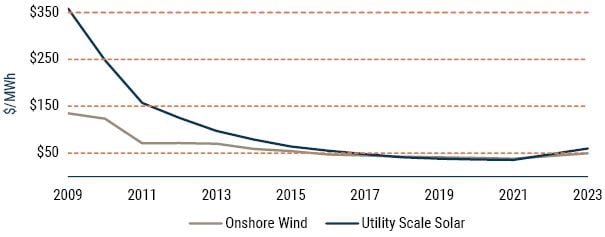
A few factors have played into the poor performance. February 2021 marked the end of a tremendous stretch for clean energy, and valuations in the sector priced in optimal conditions. Optimal conditions, unfortunately, rarely persist, and the combination of inflation and rising interest rates helped to drive the downturn. After more than a decade of declines, solar and wind costs rose due to materials inflation and supply chain issues (see Exhibit 2). The government then raised interest rates to combat inflation, and rising/high interest rates make clean energy projects more expensive to finance and less attractive as future cash flows are discounted at a higher rate. Rising rates also helped drive a revaluation of growth stocks, and clean energy companies got caught up in the broader growth unwind.
Exhibit 2: Unsubsidized Levelized Cost of Energy
As of 2023 | Source: Lazard
Over the past year, the Inflation Reduction Act (IRA) has also impacted clean energy performance but perhaps not in the way one might expect. The IRA is a landmark legislative package of clean energy incentives that will spur investment over the long term. However, over the short term, the IRA has led to project delays as people await finalization of the package’s details by the government. Public policy changes often pull demand forward, but in this case, demand has been pushed into the future.
Softened up by two and a half years of poor performance, clean energy stocks tumbled further in July and August driven by a series of quarterly results that were perceived to be disappointing. Canadian Solar, the world’s largest solar developer, beat Q2 earnings estimates by around 60% after beating Q1 earnings estimates by almost 150%. Q2 net income grew by almost 130% year over year. Revenues grew nearly 40% from Q1 but came in at the low end of guidance. The lower-than-hoped-for revenue numbers were enough to send the stock down over 30% from its early July levels. As of the end of August, Canadian Solar sat at less than five times forward earnings, territory not typically reserved for companies growing 25-30% per year.
Similarly, SolarEdge, a major solar inverter manufacturer, reported Q2 revenue growth of around 40% and earnings-per-share growth of almost 700% year over year... along with an inventory buildup that will take a couple quarters to run through. They maintained their longer-term growth guidance of 20-30%, but two quarters of inventory drag were too much for the market to take. SolarEdge dropped over 40% from its July high and sat at around 16 times forward earnings as of the end of August, a significant discount relative to ACWI at 20x and the S&P 500 at 22x. Not bad for a company growing 20-30% per year...
These types of swings are nothing new. Clean energy has always been a sentiment-driven sector, and the swings tend to be dramatic. This dynamic makes clean energy an uncomfortable place to invest for many, particularly when sentiment turns sour. However, this is not the Tech Bubble or Tech Bubble 2.0. Clean energy companies are growing profits rapidly, and the sector is maturing. At some point, one would expect the sector to withstand a bit of bad news. In the meantime, these situations create opportunities for long-term investors.
Our approach
While it’s been a difficult stretch, our investments in the sector have performed much better than the sector more broadly. In our Climate Change Strategy where we have the most exposure, for example, our clean energy outperformed the Wilderhill Clean Energy Index by around 40% net of fees from the February 2021 peak through the end of last month. Our emphasis on quality and value helped spur this relatively strong performance. We’re not just looking for companies focused on clean energy. We’re looking for companies that have competitive advantages that we expect to drive long-term success and that are attractively priced given reasonable growth expectations. As the sector struggled, higher quality, attractively priced companies held up much better than more speculative, unprofitable names.
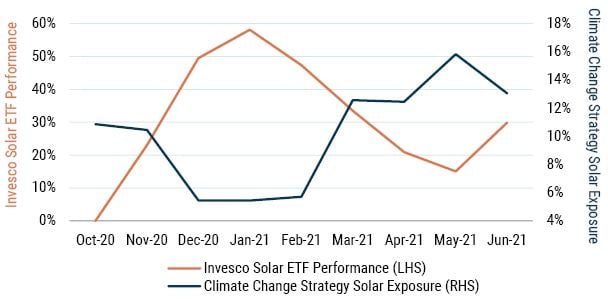
Furthermore, we invest in clean energy as part of broader strategies. 1 These broader opportunity sets enable us to move away from clean energy when it’s less attractively priced and toward more attractively valued assets. To us, value is critically important in clean energy as it’s an area where hype and excitement dominate every so often while fear and uncertainty take hold at times. In the last couple months of 2020, solar stocks, which had already risen by more than 100% the first part of the year, rocketed up another 50% (see Exhibit 3). In our Climate Change Strategy, we reacted by selling more than half of our solar exposure. When solar came back down to Earth a bit, we rebalanced back in. This allowed us to avoid the worst of the reversal in solar performance.
Exhibit 3: Our Value Orientation Means We Don’t Stand Still...
As of 6/30/2021 | Source: GMO
The above information is based on a representative account in the Strategy selected because it has the fewest restrictions and best represents the implementation of the Strategy.
The combination of our strong relative performance in clean energy, our diversifying exposure outside of clean energy, and repositioning our portfolios based on valuations helped us to weather the clean energy drop. And now the drop has created exceptional opportunities, particularly when paired with the leap in public policy support.
Public policy boom
In the last two years, the Infrastructure Investment and Jobs Act, the CHIPS and Science Act, the IRA, the REPowerEU Plan, the European Green Deal Industrial Plan, and a slew of supportive new policies at the country, state, city, business, and university levels have transformed the future of clean energy globally. Let’s focus on the biggest one, the IRA, as its potential impact is not fully appreciated. When the government announced the IRA, it was generally tagged as a $369 billion package of incentives supporting various clean energy efforts (e.g., solar, wind, biofuels, hydrogen, energy storage, carbon capture) over the next decade.
There are a few important nuances that we believe make the IRA a much bigger deal than that. First, many of the incentives within the IRA take the form of tax credits. Importantly, the tax credits are generally uncapped. The $369 billion figure is an estimate issued by a governmental office, but the ultimate federal spend may be many times larger. Second, many IRA incentives are set to be in place for the next decade, but the critical Clean Electricity Investment and Production Tax Credits will not expire until carbon emissions in the electric power sector have been cut by 75% relative to 2022 levels. Wood Mackenzie estimates that we won’t reach those levels until the late 2040s and puts the ultimate federal price tag for the IRA at potentially upward of $2.7 trillion. Finally, since the IRA incentives generally cover a relatively small proportion of the total cost (e.g., $7,500 of an electric vehicle, 30% of the cost of a wind project, etc.), each dollar of public spend will be matched by multiple dollars of private spend. In short, the IRA is a big deal. Yet, in the year after its passage, the Wilderhill Clean Energy Index fell over 40%!
The impact of the IRA has yet to be felt. Most of the last year has been spent finalizing the details for the various incentives. As noted earlier, many plans have been delayed waiting on the finalization of these details. Once the specifics have been set, it takes time for entities to make decisions, set aside capital, get approvals, obtain permits, and build facilities. The IRA will be a game changer in the long run, but for a market that tends to focus more on the short-term, it hasn’t moved the dial to this point.
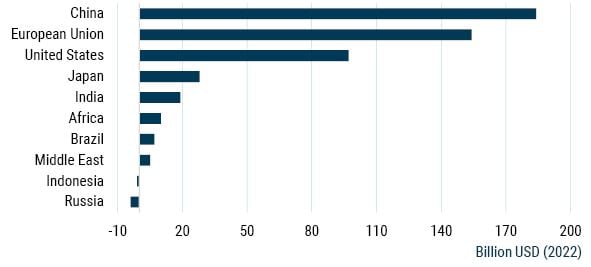
Barring a stunning change in course, it’s clear that U.S. investment in climate will dwarf anything we’ve seen before, and the same is true around the world. In fact, the U.S. has lagged China and Europe in driving clean energy investment over the last few years and needed to act aggressively in order to catch up (see Exhibit 4). Not every data point will be positive for climate supporters, but a tidal wave of support and investment is coming, and if anything, we would expect more rather than less going forward as the world grapples with the growing, dangerous impacts of climate change.
Exhibit 4: Increase in annual clean energy investment: 2019-2023e
Date: 2023 | Source: IEA
Outlook for clean energy
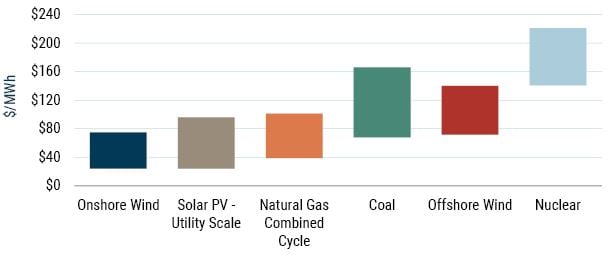
Clean energy isn’t just the future. It’s the here and now. Despite the recent jump in costs for wind and solar mentioned earlier, solar and onshore wind continue to be cheaper than natural gas, coal, and nuclear even without taking subsidies, the IRA, etc., into account (see Exhibit 5). The downward trend in renewables costs that we’ve seen the last couple decades is likely to continue, though perhaps not as consistently as we’ve grown accustomed to. We’ll still need fossil fuels for decades, but the International Energy Agency (IEA) projects $1.75 trillion of investment in clean energy this year globally compared to around $1 trillion for fossil fuels. The IRA and other public policy support more or less ensure that $1.75 trillion will look like a small number in the coming years.
Exhibit 5: Unsubsidized levelized cost of energy in the U.S. by source
As of 2023 | Source: Lazard, IJGGC, EIA
It's still early days for the IRA, but companies are already making big investments in the U.S. Korean company Qcells is building a $2.5 billion solar facility in Georgia that is expected to create 2,000 jobs. First Solar, the largest U.S. solar panel manufacturer, is building a new $1.1 billion factory in Louisiana and expanding operations in Alabama and Ohio, leading to an estimated 1,650 new jobs in aggregate. Oklahoma offered $180 million of incentives to lure Italian company Enel into building a $1+ billion solar panel factory and is trying to lure Panasonic into building a $5 billion electric vehicle battery plant. Cummins, the world’s largest diesel engine manufacturer, just announced a $3 billion joint venture with two other trucking titans to produce battery cells in the U.S. for commercial vehicles (e.g., semis, buses, medium-duty trucks) and stationary energy storage. Since the IRA was passed, more than $110 billion of investments have been announced in clean energy manufacturing, along with more than $120 billion of announced clean energy generation projects. These numbers will continue to grow as companies determine how best to take advantage of the growth in clean energy.
Despite worldwide investment, public policy support, and growth, a lot of clean energy companies hit 52-week lows last month. Even on superficial valuation metrics like price to earnings and price to forward earnings, many clean energy companies trade at substantive discounts to the market despite superior growth prospects. As of the end of August, the S&P Global Clean Energy Index and the Invesco Solar ETF traded at around 16 times forward earnings, approximately a 30% discount relative to the S&P 500. More importantly, on our discounted cash flow models, which give credit for growth but generally don’t yet incorporate the impact of the IRA, we see tremendous upside for a significant number of clean energy names, particularly in solar and biofuels, and solid upside for many more.
Of course, there are risks. There are clearly concerns about what might happen to the IRA and U.S. climate efforts more generally as politicians come and go. Political outcomes are notoriously difficult to predict, but it’s hard to imagine that future legislators would want to sabotage the economic growth and other benefits associated with climate efforts. 2 Other challenges facing clean energy include high financing costs, supply chain and permitting bottlenecks, limitations surrounding transmission, lack of energy storage, and the availability of clean energy materials. Nobody claimed rewiring the world would be easy! There are shorter-term market risks as well. Clean energy tends to be high beta and would likely struggle in a market drawdown.
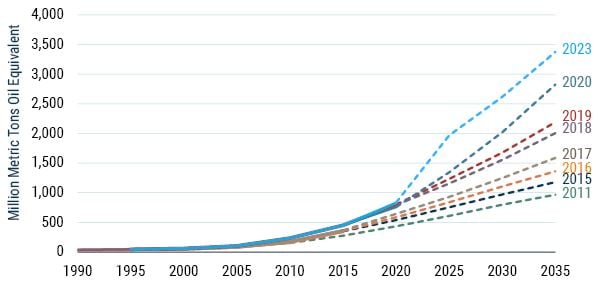
Exhibit 6: Projections for renewables consumption
As of 2023 | Source: BP
However, it’s hard not to be excited about the long-term outlook for clean energy. Due to the cost competitiveness of clean energy solutions, growth is all but guaranteed with or without federal policy support and is likely to surprise to the upside, as it has for the last 10 to 15 years (see Exhibit 6). Valuations, on the other hand, are quite sober and price in negative or negligible growth in many instances. We don’t expect a smooth ride, but we see a highly profitable future for clean energy investors.
Conclusion
Clean energy is a beaten-down sector that is growing rapidly, is increasingly profitable, and now has unprecedented, massive public policy support. While performance in clean energy has been painful the last two and a half years, that’s nothing new for a sector with a long history of wild swings. Any nascent industry is going to experience bumps along the road, but the long-term trajectory for clean energy continues to rise, and the valuations on offer are remarkably low for companies poised to generate strong long-term growth. If the volatility is shaking your resolve, clean energy may not be the place for you. For those with an iron will and an ability to look beyond the short term, the opportunities in clean energy are extraordinary.
Download article here.
In our Resources Strategy, for example, we invest in oil & gas, iron ore, aluminum, etc. In our Climate Change Strategy, we look for opportunities in electric vehicles, energy efficiency, the electric grid, agriculture, water, and materials critical for clean energy (e.g., copper, lithium, nickel, cobalt).
It may prove difficult for politicians to turn against policies that are clearly benefiting their communities. Most of the projects and jobs noted earlier are in red states. Even oil and gas states like Oklahoma are actively trying to court clean energy business. Last month, the White House announced that the IRA has already created over 170,000 jobs. The Labor Energy Partnership projects that by 2030 the IRA will have created around 1.5 million jobs and added $250 billion to the economy. There’s also concern at the highest levels of government about energy security and maintaining competitiveness with China in electric vehicles, renewables, batteries, etc.
Disclaimer: Performance data quoted represents past performance and is not predictive of future performance. Net returns are presented after the deduction of a model advisory fee and incentive fee if applicable. These returns include transaction costs, commissions and withholding taxes on foreign income and capital gains and include the reinvestment of dividends and other income, as applicable. Fees paid by accounts within the composite may be higher or lower than the model fees used. A Global Investment Performance Standards (GIPS®) Composite Report is available on GMO.com by clicking the GIPS® Composite Report link in the documents section of the strategy page. GIPS® is a registered trademark owned by CFA Institute. CFA Institute does not endorse or promote this organization, nor does it warrant the accuracy or quality of the content contained herein. Actual fees are disclosed in Part 2 of GMO's Form ADV and are also available in each strategy’s Composite Report. The portfolio is not managed relative to a benchmark. References to an index are for informational purposes only.
The views expressed are the views of Lucas White through the period ending September 14, 2023, and are subject to change at any time based on market and other conditions. This is not an offer or solicitation for the purchase or sale of any security and should not be construed as such. References to specific securities and issuers are for illustrative purposes only and are not intended to be, and should not be interpreted as, recommendations to purchase or sell such securities.
Copyright © 2023 by GMO LLC. All rights reserved.
In our Resources Strategy, for example, we invest in oil & gas, iron ore, aluminum, etc. In our Climate Change Strategy, we look for opportunities in electric vehicles, energy efficiency, the electric grid, agriculture, water, and materials critical for clean energy (e.g., copper, lithium, nickel, cobalt).
It may prove difficult for politicians to turn against policies that are clearly benefiting their communities. Most of the projects and jobs noted earlier are in red states. Even oil and gas states like Oklahoma are actively trying to court clean energy business. Last month, the White House announced that the IRA has already created over 170,000 jobs. The Labor Energy Partnership projects that by 2030 the IRA will have created around 1.5 million jobs and added $250 billion to the economy. There’s also concern at the highest levels of government about energy security and maintaining competitiveness with China in electric vehicles, renewables, batteries, etc.


