Introduction
In September, we wrote a piece discussing some of the growing pains that have impacted clean energy in the last few years. 1 Despite what we believe are compelling long-term growth prospects, the sector has continued to struggle over the past two quarters. Naturally, the weakness has led us to question our assumptions, sharpen our pencils, and revisit our models. New information flows on a daily basis and markets swing wildly on the news, but little has changed in the long-term outlook. While frustrated with the performance woes, we’ve been confronted with similar market dislocations in recent years and have taken advantage of the associated opportunities. We see bright light at the end of the tunnel and urge investors to consider the long-term return opportunity.
From Dark to Darker?
Over the course of the fourth quarter of last year and the first quarter of this year, clean energy stocks continued to struggle, with the WilderHill Clean Energy Index dropping a bit more than 25%. This left the index down by over 80% since its peak in February 2021, a remarkable fall for a sector with strong growth prospects, improving economics, and growing policy support. So, what drove the continued weakness? The biggest factors have been strong economic data, highlighted by an unexpectedly strong job market, and stubbornly high CPI figures, which have shaken the market’s expectations surrounding interest rate cuts this year. Given clean energy’s sensitivity to interest rates, the reduced certainty on rate cuts has been decidedly negative, particularly for sentiment.
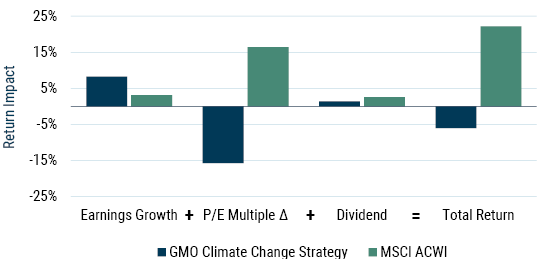
The clean energy sector continues to be largely sentiment driven. As the sector matures, the focus will evolve toward fundamentals, but in the meantime, any piece of news that points to a “higher for longer” interest rate scenario torpedoes stock prices. Approximately half of our Climate Change Strategy is invested in clean energy, and the impact of sentiment can be seen clearly in the strategy’s performance last year. When decomposing our returns into components of return (earnings growth, P/E multiple expansion/contraction, and dividends), we see that our Climate Change Strategy grew earnings at almost three times the rate of the broad equity market, yet the market applied a substantially reduced multiple to those strong earnings, a stark contrast to the large multiple expansion we saw on the tepid earnings growth of the broad equity market (see Exhibit 1). This is consistent with what we’ve seen since the inception of our strategy in 2017: superior earnings growth with multiples lagging those of the broad market.
Exhibit 1: Sentiment Has Been More Important Than Fundamentals
Return decomposition of GMO Climate Change Strategy 2023
As of 12/31/2023 | Source: MSCI, GMO
The above information is based on a representative account in the strategy selected because it has the fewest restrictions and best represents the implementation of the strategy.
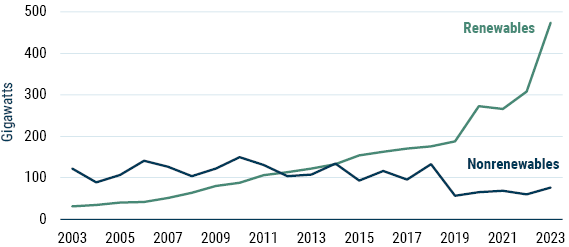
Interest rate headwinds have undoubtedly slowed growth, leading to project delays, inventory buildups, and lower than expected fundamentals. However, while rate jumps can shake nerves and stall projects, the economics of clean energy remain attractive at current rates, and there has been continued growth in this high-rate environment. In fact, we saw vast renewable energy deployment in 2023 with renewables representing a record 86% of new power capacity additions globally (see Exhibit 2). While much of this surge came from China, the investment mix was much the same in the U.S. where solar, wind, and storage comprised almost 85% of planned utility-scale capacity additions.
2
Exhibit 2: Global Power Capacity Expansion
As of 12/31/2023 | Source: International Renewable Energy Agency (IRENA)
While interest rates remain high, we have recently seen signs of stabilization and improving conditions in clean energy industries. Inventory buildups are being worked through, companies have seen growth, and various companies have beaten expectations. Furthermore, the higher quality companies we invest in have been growing market share during this shake out. It’s too early to say the tide has turned, but if we’re near the bottom, the bottom isn’t so bad.
Bright Spots on the Horizon?
Going forward, there are a variety of reasons to feel good about clean energy. Interest rates are expected to come down in both Europe and the U.S. over the next year and falling rates would both improve the economics of clean energy and, perhaps more importantly, boost sentiment. Inflation Reduction Act (IRA) money is expected to start flowing this year and drive trillions of dollars of investment into renewables, electric vehicles, carbon capture, hydrogen, etc. Electricity prices continue to rise while the costs for solar and wind are expected to continue to fall, making the value proposition for renewables increasingly attractive. The Federal Energy Regulatory Commission (FERC) has implemented changes to alleviate the interconnection logjam that has hindered renewable projects. AI and data center growth are poised to add substantively to electricity demand, and the Microsofts of the world tend to have decarbonization commitments, yet another potential tailwind for renewables. These and other factors should help push the sector toward the next phase in the cycle.
Of course, there are many challenges ahead. Electric vehicle infrastructure needs dramatic improvement, and costs for electric vehicles must continue to fall. Advances in energy storage and enhancements to our grids are necessary to support a greater proportion of intermittent renewable power. Nascent industries like carbon capture, hydrogen, and sustainable aviation fuel (SAF) are promising but still have a way to go before making a significant impact. The good news is that trillions of dollars of capital and legions of smart people are working on these issues. It won’t happen overnight, but progress on these challenges may allow the transition to move faster than expected – a trend that we’ve seen repeatedly over the last 15 years.
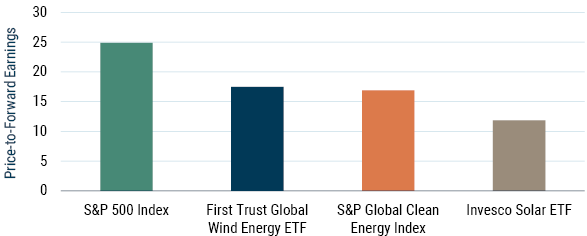
The market clearly disagrees with our assessment of the long-term growth prospects for clean energy…or, perhaps more accurately, the market is neurotically focused on the short term. At the end of March, the Invesco Solar ETF sat at less than 12 times forward earnings, more than a 50% discount relative to the S&P 500 (see Exhibit 3). The S&P Global Clean Energy Index and First Trust Global Wind Energy ETF traded at greater than 30% discounts to the broad marke.
Exhibit 3: Despite Superior Growth, Clean Energy Companies Trade at a Large Discount
As of 3/31/2024 | Source: Bloomberg, GMO
These companies are being priced to undergrow the market or even shrink, a prospect hard to square with the growth expected and, quite frankly, needed for the transition. In any major transition, there are bumps along the road, but the path to clean energy is clearly well underway.
We’ve Seen Movies Like This Before
Given the purported efficiency of equity markets, it seems hard to believe that a sector that’s been beaten up this badly could possibly have compelling long-term prospects. Yet, in our areas of coverage, we’ve seen this sort of thing multiple times in recent years, and we’ve capitalized on the opportunities created by these dislocations to generate strong returns.
In January 2016, on the back of weak metals prices, mining companies were down over 70% from their 2011 peak (see Exhibit 4). Many major mining companies were down 90% or more and being priced for a high risk of bankruptcy. The world can’t function without metals, however, and when metals prices bounced back a bit and fear subsided, mining companies rallied by over 550% in just a few years, more than quadrupling the broad equity market.
Exhibit 4: Dislocation in Mining 2015/2016
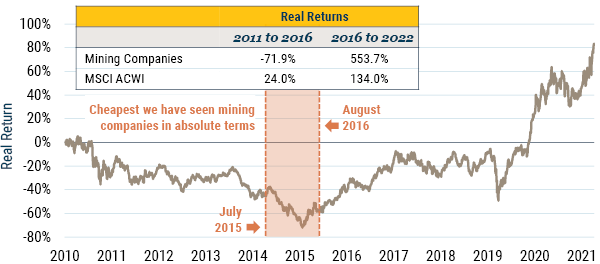
Whole period: 1/2011 – 4/2022 | Trough: 1/20/2016 | Source: Bloomberg, GMO
A few years later, the fossil fuel industry endured a similar panic (see Exhibit 5). Falling fossil fuel prices conspired with narratives surrounding electric vehicles and fossil fuel demand evaporation to drive the industry down over 70%. Once again, an industry absolutely critical to the functioning of the global economy bounced back with a vengeance, as fossil fuels have rallied almost 300% and more than tripled the return of the market the last few years.
Exhibit 5: Dislocation in Fossil Fuels 2020/2021
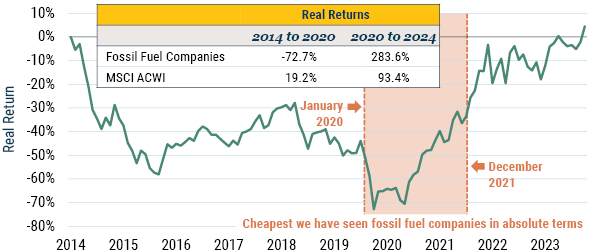
Whole period: 7/2014–3/2024 | Trough: 3/31/2020 | Source: Bloomberg, GMO
To have a major dislocation in a sector of the market, you need three things: (1) weak current conditions, (2) uncertainty about when conditions will improve, and (3) a volatile/scary niche of the market that’s tempting for investors to avoid. The clean energy sector places solid checkmarks in all three boxes, and just as with previous dislocations, we think investors can profit from securities that have been priced at a fraction of their long-term fair value.
Conclusions
Despite the abysmal stock market performance, clean energy continues to grow rapidly. Interest rate increases, among other things, have at least temporarily slowed growth. However, we don’t agonize over the timing and magnitude of rate cuts. The stock market struggles have become tiresome, no doubt, but the prevailing interest rates have little bearing on the long-term profitability of the companies we’ve invested in, and the current pricing has allowed us to build positions in growing companies at steep discounts.
The disconnect between the prospects for clean energy and how the companies are being priced is somewhat stunning. While we’ve taken advantage of similar dislocations in recent years, we’re not aware of a historical precedent quite like this. Typically, these sorts of dislocations occur in dire scenarios. However, just about every country in the world is committed to long-term secular growth in clean energy. Fossil fuels are finite, and the climate has become increasingly unstable, surpassing the expectations of the distressed scientific community.
While we can’t know exactly how things will play out, we expect conditions to improve, fundamentals to rise, and multiples to expand on those higher fundamentals. The bad news is that we won’t know the timing ex-ante. The good news is that we don’t need to. It’s almost impossible to catch the exact bottom, but we see great opportunities to invest in growing companies at bargain prices, and we’ve been heartened to see a number of our clients taking advantage. For those that are focused on the long-term and can tolerate the volatility, we recommend taking a hard look at clean energy. It’s time to pound the table.
Download article here.
See Turbulence on the Path to Transformation (White 2023).
U.S. Energy Information Administration (EIA)
Disclaimer: The views expressed are the views of Lucas White through the period ending April 2024 and are subject to change at any time based on market and other conditions. This is not an offer or solicitation for the purchase or sale of any security and should not be construed as such. References to specific securities and issuers are for illustrative purposes only and are not intended to be, and should not be interpreted as, recommendations to purchase or sell such securities.
Performance data quoted represents past performance and is not predictive of future performance. Net returns are presented after the deduction of a model advisory fee and incentive fee if applicable. These returns include transaction costs, commissions and withholding taxes on foreign income and capital gains and include the reinvestment of dividends and other income, as applicable. Fees paid by accounts within the composite may be higher or lower than the model fees used. A Global Investment Performance Standards (GIPS®) Composite Report is available on GMO.com by clicking the GIPS® Composite Report link in the documents section of the strategy page. GIPS® is a registered trademark owned by CFA Institute. CFA Institute does not endorse or promote this organization, nor does it warrant the accuracy or quality of the content contained herein. Actual fees are disclosed in Part 2 of GMO's Form ADV and are also available in each strategy’s Composite Report. The portfolio is not managed relative to a benchmark. References to an index are for informational purposes only.
MSCI data may not be reproduced or used for any other purpose. MSCI provides no warranties, has not prepared or approved this report, and has no liability hereunder. Please visit https://www.gmo.com/americas/benchmark-disclaimers/ to review the complete benchmark disclaimer notice.
S&P does not guarantee the accuracy, adequacy, completeness or availability of any data or information and is not responsible for any errors or omissions from the use of such data or information. Reproduction of the data or information in any form is prohibited except with the prior written permission of S&P or its third-party licensors. Please visit https://www.gmo.com/americas/benchmark-disclaimers/ to review the complete benchmark disclaimer notice.
See Turbulence on the Path to Transformation (White 2023).
U.S. Energy Information Administration (EIA)

