Some allocators may focus their search efforts on corporate credit segments or simply a portfolio that can opportunistically trade across fixed income sectors. We encourage investors to consider including a dedicated allocation to emerging market debt (hard currency) because we believe:
- Emerging market debt may offer excellent long-term beta return
- Emerging market debt may offer strong alpha potential
- Many investors are underallocated to the asset class currently
Beta Exposure: Excess Credit Returns & Diversification
Emerging market debt is an asset class that has delivered strong credit returns for the risk underwritten, and the credit cycle is differentiated from corporate or consumer cycles.
Historically, emerging market debt has offered an average credit spread 1 of 370 bps over duration-matched Treasuries to bear the risk of sovereign default. Sovereigns rarely default 2 and almost always offer decent recovery values (because sovereigns need to access the credit markets again, in contrast to corporations who can simply disappear). The asset class has offered not only a lower annual default rate, but also a diversifying pattern of defaults relative to corporate or consumer defaults, which follow the U.S. business cycle. 3 While emerging market debt investors will likely suffer mark-to-market losses from spread-widening in tough economic environments, that temporary pain is inherently different from the permanent impairment of a default.
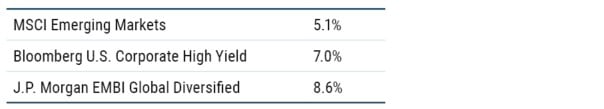
Over the past 30 years, emerging market bonds have delivered 8.6% annualized return compared to 5.1% from emerging market equities and 7.0% for U.S. corporate high yield – this is an asset class that deserves space in a diversified portfolio.
30-Year Annualized Returns in USD (1994-2024)
Alpha Opportunity: Consistent Active Outperformance
Emerging market debt is an inefficient asset class with high breadth and complexity spanning:
- countries (GMO allocates to over 85 countries),
- individual bond issues (some with unique terms), and
- sovereign debt, as well as sovereign-controlled corporate debt (e.g., state-owned utility or oil companies).
Index construction favors liquidity, not return maximization. As a result, competent active management has historically been well rewarded. The median manager has offered consistent excess returns, and a top manager can significantly distance themselves from the rest.
EMERGING COUNTRY DEBT (HARD CURRENCY) ALPHA
Annualized Excess Returns (Net) vs. J.P. Morgan EMBI Global Diversified Index
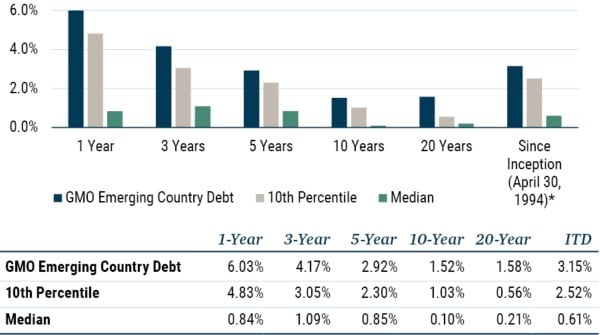
As of 12/31/2024 | Source: eVestment
*It’s worth noting that there are few managers with 30-year track records. As such, data since inception is based on just 4 observations. The number of observations in subsequent periods were: 27 (20-Year), 61 (10-Year), 77 (5-Year), 84 (3-Year), and 92 (1-Year).
Insufficient Exposure: Investors Underallocate to EM Debt
Despite the solid realized long-term returns and diversification properties of emerging market debt, we suspect that many investors may have little to no exposure to this asset class. Of the fixed income strategies listed in the eVestment database, only 4.2% of strategy AUM have emerging market debt in the benchmark. 4 For flexible mandates that have the ability to hold emerging market debt, the average allocation for the 20 largest strategies was 7.6% as of December 31, 2024. 5
We believe a dedicated active manager with emerging market debt expertise is necessary to fully capture the alpha potential of this asset class. Many flexible credit strategies that tactically allocate to this space are primarily accessing beta exposure.
Emerging market debt is not without its risks as detailed above; however, investors have historically been paid a handsome spread to underwrite the risk of sovereign default. In addition to the beta return, we believe emerging market debt provides consistent, strong reward for capable active management. In our view, the only way to fully capitalize on both the beta and the alpha opportunity is through a dedicated, active emerging market debt mandate.
Download article here.
Spread is duration weighted using J.P. Morgan EMBI Global Diversified Index as a proxy for emerging market debt. Applying this weighting methodology reduces the impact of sovereign and quasi-sovereign issues in default on the overall index spread.
Average annual emerging market sovereign defaults are less than 2% with an average recovery of roughly 40%, according to Moody’s data.
For more on this point, please see The What-Why-When-How Guide to Owning Emerging Debt (2024).
As of December 31, 2024.
Source: eVestment, GMO.
Performance data quoted represents past performance and is not predictive of future performance.
Net returns are presented after the deduction of a model advisory fee and incentive fee if applicable. These returns include transaction costs, commissions and withholding taxes on foreign income and capital gains and include the reinvestment of dividends and other income, as applicable. Fees paid by accounts within the composite may be higher or lower than the model fees used. GMO LLC claims compliance with the Global Investment Performance Standards (GIPS®). A Global Investment Performance Standards (GIPS®) Composite Report is available on GMO.com by clicking the GIPS® Composite Report link in the documents section of the strategy page. GIPS® is a registered trademark owned by CFA Institute. CFA Institute does not endorse or promote this organization, nor does it warrant the accuracy or quality of the content contained herein. Actual fees are disclosed in Part 2 of GMO's Form ADV and are also available in each strategy’s Composite Report.
Disclaimer: The views expressed are the views of Catherine LeGraw and Ben Inker through the period ending February 2025 and are subject to change at any time based on market and other conditions. This is not an offer or solicitation for the purchase or sale of any security and should not be construed as such. References to specific securities and issuers are for illustrative purposes only and are not intended to be, and should not be interpreted as, recommendations to purchase or sell such securities.
Copyright © 2025 by GMO LLC. All rights reserved.
Spread is duration weighted using J.P. Morgan EMBI Global Diversified Index as a proxy for emerging market debt. Applying this weighting methodology reduces the impact of sovereign and quasi-sovereign issues in default on the overall index spread.
Average annual emerging market sovereign defaults are less than 2% with an average recovery of roughly 40%, according to Moody’s data.
For more on this point, please see The What-Why-When-How Guide to Owning Emerging Debt (2024).
As of December 31, 2024.
Source: eVestment, GMO.