Introduction
As GMO celebrates its 30th anniversary managing emerging debt this year, we offer our comprehensive guide to emerging debt markets. Given the tumultuous recent events – a global pandemic, defaults, repricing of interest rates, relentless strength in the U.S. dollar – we’ll focus on the Why as a starting point. Then we’ll dive into the proliferating How, covering strategies and vehicles. For the When, we’ll give a quick overview of our Quarterly Valuation Update publication. Finally, we’ll relegate the What to the end for those looking for a more detailed introduction to the asset class, including terminology, market structure, associated benchmarks, and an overview of GMO’s history managing EMD.
Why Consider Emerging Debt at All?
Recent years have dented the returns (and therefore some allocators’ enthusiasm) for emerging debt markets along with other public credit markets. Exhibit 1 compares the three main EMD types – hard currency sovereigns and quasi-sovereigns (JPM EMBIG-D), hard currency corporates (JPM CEMBIB-D), and local currency sovereigns (JPM GBI-EMGD) – with U.S. corporate high yield (Bloomberg USHY). 1 While for many years EMBIG-D and USHY were neck and neck, lately the latter pulled decisively away as EMBIG-D’s longer USD interest rate duration took a one-time relative hit in 2022, and a spate of pandemic defaults and sanctions-related hits also took their toll. Meanwhile, unprecedented U.S. pandemic stimulus, coupled with creative alternative financing sources in private credit markets for U.S. corporate high yield borrowers, has perhaps shifted the default cycle from public high yield to private markets. In EM corporates, CEMBIB-D chugged along at a lower total return level (yet with a higher Sharpe ratio) but was hit recently by defaults in the huge China property sector. And GBI-EMGD – after a roaring start 20 years ago – has bounced around below its 2012 high-water mark! So why make a distinct allocation to EMD at all? Why not simply select a broader mandate (perhaps multi-sector fixed income or multi-asset credit) and let the manager decide when and how to allocate?
The answer relates to the concepts of value, alpha, and diversification.
Exhibit 1: Hard and Local Currency EMD vs. U.S HY
Cumulative Total Return
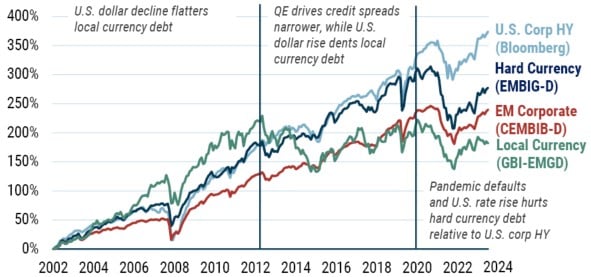
As of June 30, 2024 | Source: J.P. Morgan, Bloomberg
Value
To make a strategic allocation to any risky fixed income asset, you must expect that it will deliver excess returns over your USD duration hurdle (USD cash or USD duration of some tenor), that is, it must offer value. For risky credit markets like hard currency EMD or U.S. corporate high yield, this boils down to a view that the credit spread offered is higher than your estimate of future losses due to default. This has generally been the case for both: Exhibit 2 shows the excess return (total return minus matched maturity USD duration return) for EMBIG-D and USHY, showing that over time they indeed offer value to greater or lesser degrees.
Exhibit 2: Hard Currency EMD vs. U.S. HY
Cumulative Excess Return
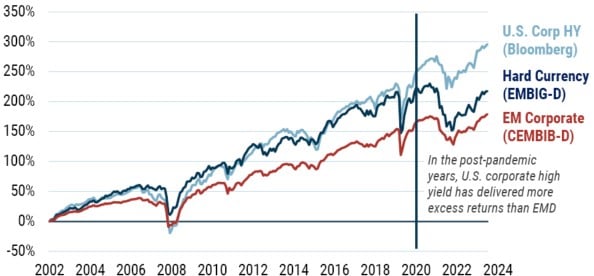
As of June 30, 2024 | Source: J.P. Morgan, Bloomberg
Whether local currency debt allocations will deliver excess returns relative to cash in the relevant funding currency (a U.S. investor, say, funding a local currency debt investment out of USD cash, or an Australian investor funding the same out of AUD cash) 2 is a two-part valuation question: FX and local interest rates. By far the more important question relates to the FX valuation. Here our assessment compares the GBI-EMGD currencies’ weighted-average “carry” (excess yield differential of the basket of short-term local currency interest rates in GBI-EMGD vs. USD cash) to the aggregate fundamentals of the currencies (valuations, balance of payments, etc.). Note that, unlike hard currency credit (where credit spreads are positive), currency carry need not be positive. For example, with U.S. dollar short-term cash rates high at present (3-month U.S. T-bills are ~5.3%), a number of GBI-EMGD countries have had lower cash rates (e.g., 3-month bills in Czech Republic are ~4%, or -1.3% carry relative to U.S. dollars). However, if the fundamental valuation of CZK is such that it can appreciate by more than 1.3% per year, it can still deliver positive total return to USD-based investors. Comparing aggregate GBI-EMGD carry relative to aggregate GBI-EMGD fundamental valuations, therefore, is critical when assessing a local debt allocation. Secondarily, although still importantly, is the question of whether EM local currency bonds can outperform their own carry, which is exactly analogous to a USD investor wondering whether to extend duration from cash to 10-year U.S. Treasuries. Here we compare the price (bond carry relative to cash, rolldown, term premium) in each local market to fundamentals that drive bond excess returns (fair value based on Taylor Rule neutral rate, inflation basket, and risk premium measures). 3
Exhibit 3 decomposes GBI-EMGD's historical returns into cumulative contribution from currency spot return, currency carry return, and local currency bond excess return (over currency carry return). You can see that currency spot return has not been helpful to local debt returns in recent years, with the high-water mark for the GBI-EMGD in USD terms back hit in 2012. The 2022 rise in global interest rates is also notable: most EM local bond yields repriced higher in tandem, denting excess bond return contributions.
Exhibit 3: Cumulative Return Contributions to EM Local Debt (GBI-EMGD)
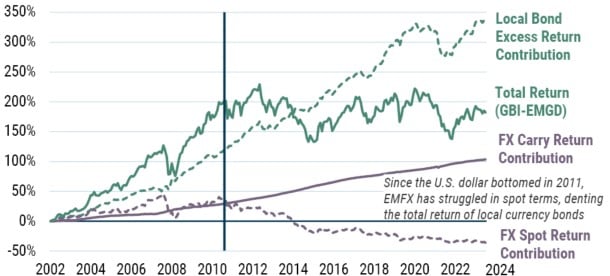
As of June 30, 2024 | Source: GMO calculations using J.P. Morgan data
Therefore, as an allocation matter, we observe that starting valuation makes a much larger difference for local currency debt than for credit, whether EMD or HY. We’ve been saying this since local debt arrived on allocators’ radars in the mid-2000s, publishing Facts and Fantasies about Investing in Emerging Country Local Currency Debt in May 2007. 4 In the When section of this paper, you’ll see that finally, after about a decade, we believe medium-term allocations to local currency debt are warranted on valuation grounds. We dived into this topic recently in Emerging Local Debt: A Once-in-a-Generation Opportunity. 5
So, to answer our question about dedicated EMD vs. multi-sector-type allocations: because the credit spread for risky assets like EM credit and HY generally overcompensate an investor for actual credit losses, an “always on” allocation, either via dedicated mandates or via multi-sector credit strategies, is warranted. With the spate of pandemic- and war-related defaults behind us, we expect hard currency EMD to return to its pre-pandemic pattern of excess returns. Local currency debt, on the other hand, is more of an opportunistic allocation when valuations are supportive, as they are now. Frontier local debt, discussed later, is a new, potentially diversifying area for allocation.
Alpha
Emerging debt has been a high alpha asset class, and we’re proud that at year-end, GMO led eVestment's peer rankings (Exhibit 4). Given the inefficiencies we see, we believe this will continue to be a high alpha space for some time. Exhibit 4 shows eVestment data for dedicated hard, local, and corporate EMD universes, as well as major ETFs. It also shows U.S. corporate HY alpha. After-fee median manager alpha has been positive in EM hard and local currency (although not corporate or U.S. HY) debt over the 1-, 3-, 5-, and 10-year periods, the tumultuous recent years notwithstanding. Given such high long-term delivered alpha in hard and local EM debt, it’s curious to us the choice of passive ETFs, which typically underperform the benchmarks in line with their relatively high fees. 6
Exhibit 4: eVestment Active Manager and Passive ETF Alpha (%)
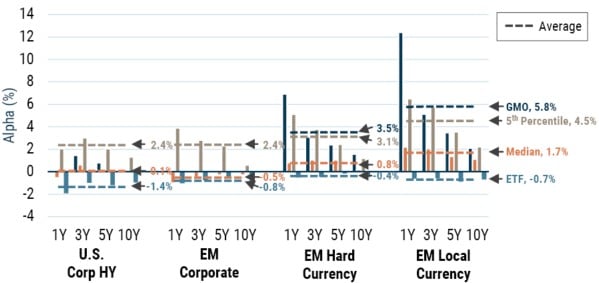
As of December 31, 2023 | Source: eVestment, Bloomberg, iShares
For the U.S. Corporate High Yield universe we are comparing all managers' returns to the Bloomberg U.S. High Yield Index in stating alpha. We recognize that due to their higher liquidity expectations, the main HY ETF, as well as our own High Yield Strategy, are formally benchmarked to the Markit iBoxx USD Liquid High Yield Index.
Whether such dedicated EMD alpha flows up to multi-sector or core-plus-type mandates is an interesting question we’ll address a bit later in the How section. For now, the main conclusion is that hard and local currency EMD is a place with demonstrated high alpha potential, which we believe itself can be a reason to allocate.
Diversification
We address the diversification properties of risky fixed income from two relevant perspectives: that of an asset allocator individually considering adding risky fixed income assets to their overall portfolio; and that of a multi-asset credit manager tasked with dynamically allocating among these same risky fixed income assets. There is a statistical element to this (i.e., do the assets co-move to such an extent that they aren’t particularly diversifying?) and there is a fundamental element to this (i.e., are the default cycles and currency cycles the same?).
Statistical diversification for all risky fixed income segments has been declining since the Global Financial Crisis in 2008. Exhibit 5 shows the four asset class segments’ correlation with typical 60/40 asset allocations as proxied by the MSCI ACWI (equities) and the Bloomberg U.S. Aggregate Index (bonds). Keep in mind that, definitionally, U.S. corporate HY shares no overlap with the bonds in the exclusively investment-grade U.S. Aggregate Index, 7 although the equities of some of the high yield issuers are in the ACWI. Nonetheless, U.S. corporate HY has the highest correlation with the 60/40 basket.
About 50% of EMBIG-D and about 60% of CEMBIB-D are Aggregate eligible because they’re investment grade and in USD. Still, statistically speaking they have been more diversifying than U.S. corporate HY. Local currency debt has been the most diversifying in recent years due to the currency component.
Exhibit 5: Correlation with 60% MSCI ACWI/40% Bloomberg U.S. Aggregate portfolio
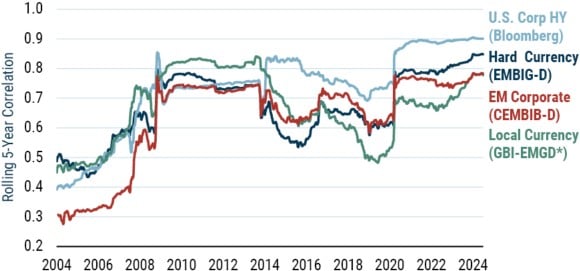
As of June 30, 2024 | Source: J.P. Morgan, Bloomberg, MSCI, GMO
*Prior to January 1, 2003, local currency returns are proxied using the J.P. Morgan Emerging Market Local Markets Index Plus (ELMI+), which tracks currencies from major emerging markets. The correlation with EM Corporates (CEMBIB-D) before January 2007 is calculated using an expanding period of less than 5 years.
Fundamentally, default cycles are most diversifying in EM sovereign credit. Outside the pandemic, the asset class typically has one or two defaults per year, whereas U.S. corporate HY default cycles usually align with the U.S. business cycle. Exhibit 6 shows the default rate by year for global sovereigns, 8 EM corporate HY, and U.S. corporate HY.
Exhibit 6: Default Rate by Year
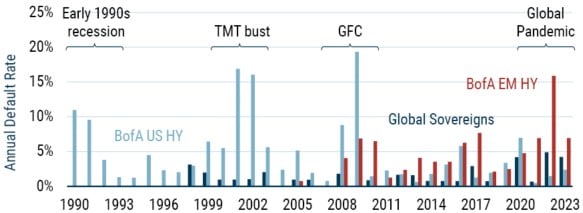
As of December 31, 2023 | Source: Moody’s, BofA Global Research
As noted earlier, U.S. corporate HY benefited from tremendous fiscal and monetary policy support during the pandemic, perhaps forestalling the default cycle that would have come with that economic downturn. Another way to say this is that the pandemic was an especially unusual event from which longer term conclusions likely shouldn’t be drawn. Defaults in CEMBI tend to be more numerous given its geographic diversity. For GBI-EMGD, the analogous question to ask is about fundamental FX weakness. This follows the USD’s cycle, which is entirely different. As observed previously in Exhibit 1, the USD’s decline from 2004 to 2011 flattered EMFX, and its rise since then has hurt EMFX.
From the point of view of building multi-asset credit portfolios, we at GMO use a dynamic approach to time relative discrepancies among the included fixed income assets (EM sovereigns, U.S. corporate HY, leveraged loans, securitized credit, and U.S. investment grade). Where each asset is in its valuation and default cycles are key inputs to this process.
Net net, we don’t want to oversell EMD or any risky fixed income asset class on statistical diversification. On the other hand, emerging debt markets are fundamentally diversifying as the borrower set is very different from global equities in a way that corporates are not. EM sovereign credit is fundamentally diversifying to corporate credit portfolios, whereas EM local debt diversifies major currency exposures. Indeed, for those wishing to diversify away from the U.S. dollar given its generationally high valuations, local currency debt – whether core GBI-EMGD or EM local frontier – is worth a look.
How Does One Access Emerging Debt Markets?
Vehicles
Most active EMD managers, including GMO, offer pooled vehicles and separately managed accounts.
When offering EMD via pooled vehicles, it’s prudent to choose a manager who has a thoughtful approach to ensuring shareholder equity in the face of flows in open-ended funds given that the underlying bonds have high transactions costs. Outside of the U.S., this is generally handled via swing pricing, where the customer’s effective NAV differs from the stated NAV to the degree of the transaction costs of the underlying bonds. Although the SEC has proposed mandating swing pricing for open-ended funds in the U.S. for the same reason, 9 it is not yet in effect.
Passive EMD ETFs exist, albeit at relatively high fees and occasionally very high tracking error. Unlike core fixed income markets, major (>$1 billion) passive EMD ETF fees range between 20-45 bps 10 and tracking error (both relative to the index and in terms of the ETF’s price relative to its NAV) can be high at times of stress. This happens when the price of the ETF differs from the intra-day estimated NAV of the fund due to transactions costs in the underlying bonds causing friction to the creation/redemption process. In this way, it’s analogous to swing pricing, except that the swing size is unknown ex-ante. Given our earlier observations about high net-of-fee alpha potential, we wouldn’t recommend allocating to passive approaches. 11
Active EMD ETFs are at a very early stage with J.P. Morgan’s Global ETF Handbook listing eight EM debt-related active ETFs totalling about $600 million (relative to $31 billion in passive ETFs). Given the high transaction costs of the underlying markets, the active ETF price bid/offers tend to be very high (0.5-1.5%, depending on how active they are versus <0.1% for major passive ETFs), 12 perhaps contributing to their lack of adoption in the space. Further, for either active or passive ETF style, the potential tax shield is much lower for emerging debt than it is for equities given the contribution of income to the total return.
Separately managed accounts (SMAs) don’t require anti-dilution mechanisms because there is only one shareholder who absorbs their own cost of flows. SMAs allow flexibility to constrain the manager in specific ways at the cost of some additional complexities in setting up and retiring the account.
GMO’s Emerging Debt Strategies and Market Context
Two broad categories of strategies exist, benchmark-relative and total return/cash plus (often marketed as “opportunistic”). Given that the expected excess return to hard currency EMD is positive, most managers normally retain a net long position, thus giving rise to a performance benchmark or hurdle expectation.
Benchmark-Relative
Within benchmark-relative strategies, there are two sub-categories: single-benchmark “dedicated” (e.g., EMBIG-D or GBI-EMGD or CEMBIB-D relative) and blended benchmark (relative to any blend of these three, e.g., 25% EMBIG-D/50% GBI-EMGD/25% CEMBIB-D). Depending on the active manager’s approach, choosing among a single benchmark or a blended benchmark may either signal limits to an opportunity set (for example, a CEMBI manager that cannot buy sovereigns or a hard currency manager that must limit unhedged local currency exposures) and/or may signal “normal” portfolio characteristics. For example, depending on the proportions of EMBIG-D/CEMBIG-D/GBI-EMGD in the benchmark blend, one gets different USD vs. local currency exposures, different sovereign vs. corporate exposures, different credit rating distributions, and different durations. These usually are important normal portfolio characteristics to consider when allocating. In the 25/50/25 EMBIG-D/GBI-EMGD/CEMBIB-D example above, this would signal a portfolio that normally would be 50/50 USD vs. local currency, and 75/25 sovereigns vs. corporates. On the other hand, a 50/50 EMBIG-D/GBI-EMGD blend would signal the same 50/50 USD vs. local currency proportion while also signaling that normally corporates wouldn’t be expected (but may be opportunistically added if permitted).
Our flagship strategy, incepted in 1994, is a single-benchmark hard currency debt strategy that seeks total return in excess of the EMBIG-D. Our local currency debt strategy, incepted in 2008, is also a single-benchmark strategy, in its case seeking a total return in excess of the GBI-EMGD. Regardless of their single benchmarks, both strategies use a blended investment universe, routinely buying issues and taking exposures from an opportunity set that spans EMBIG, GBI-EMGD, CEMBIG, and beyond to deliver our alpha.
Because we focus on alpha and use a blended opportunity set, we are able to offer any benchmark blend that a client may choose. A salient observation is that the country concentration doesn’t change much across benchmark blends (see Exhibit 7), given that geopolitical risks can be high for certain countries. For example, at the end of 2021, before the Ukraine invasion, Russia was 3.3% of EMBIG-D, 7.2% of GBI-EMGD, and 4.1% of CEMBIB-D, so depending on how you blended the benchmarks, you ended up with 4.9-5.5% Russia. Today, China is perhaps the most geopolitically relevant country, and it’s 3.9% of EMBIG, 10% of GBI-EMGD, 13 and 7% of CEMBIB-D. 14
Exhibit 7: Country (Top 15) and Regional Comparisons Across Benchmarks
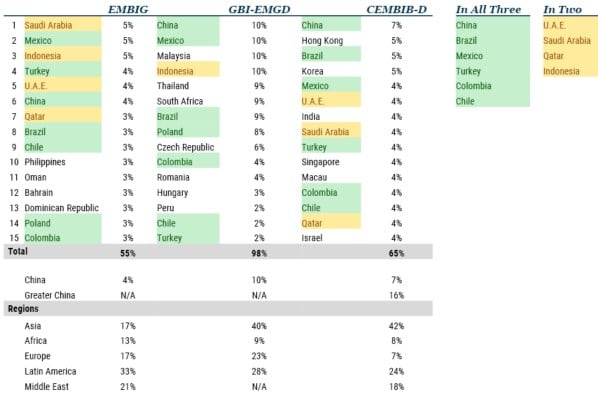
As of June 30, 2024 | Source: J.P. Morgan
Opportunistic/Total Return
Opportunistic, or total return, strategies don’t come with a normal portfolio blend expectation, although they will generally be net long credit given the positive expected return to credit. The opportunistic parts tend to be in local currencies and sometimes corporates. Typically, the strategy objective may be something like “provides total return through broad exposures across emerging debt markets.” These are best judged using a cash-plus performance hurdle, generally something like cash plus 2-4% for long-only constrained strategies, or cash plus 5% or more for those that employ leverage and shorting. GMO’s approach to the strategies described above can be found in No Stone Unturned: Exploiting the Full Breadth of Opportunity Across Emerging Market Debt (2022).
In terms of their approach to alpha, it’s more common for managers to emphasize top-down elements (i.e., views on interest rates, countries, and currencies) than bottom-up elements (i.e, individual issue selection). The larger the manager’s AUM, the more constrained they are to taking a top-down approach, given the limited quantity of interesting, alpha-accretive individual issues available. GMO is unique in that we emphasize the bottom-up elements (and moreover, are willing to constrain our AUM to do so) – an approach that we’re proud to say has delivered the eVestment peer-relative results shown in Exhibit 4. For our flagship hard currency debt strategy, bottom-up security selection is responsible for about 75% of the total alpha. For our local currency debt strategy, this figure is about 50%. For the rest of the manager universe, these figures typically top out at 10%. For this reason, our investors see us as a core, differentiating manager.
Constrained, Focused, Dual (ESG) Objective, and Thematic Strategies
At $42 trillion, 15 the EMD universe has become so large that it lends itself to a variety of constrained, focused, dual-objective and thematic strategies.
Constrained strategies generally are constrained to higher credit quality issues. Some mandates are investment grade only, while others are ex-CCC and below. In 2023 we wrote about higher quality EM local markets as less risky ways to earn a yield pickup vs. developed markets government bonds, for example.
Focused strategies, on the other hand, may go the other way. In 2023, we created a strategy for a client who wanted to capitalize on the post-pandemic distressed opportunity we had identified where, through our experience on restructuring committees and careful issue selection, we aim to achieve high total returns for investors. This year we’ve researched and are developing a local markets strategy focused on frontier EM local debt, a sub-segment of the high-yielding, more-difficult-to-analyze-and-implement markets that are diversifying to major hard and local currency EM markets. Frontier EM local debt’s characteristics – high yield and low volatility (highly diversifying to traditional assets), the intensity of analysis required, and the complexity of establishing positions – make it the most analogous sub-segment the EMD public markets offer to private credit alternatives.
In the post-GFC/QE years, another type of focused strategy gained popularity across fixed income markets: short duration. The idea was that amid low global interest rates, such strategies would avoid duration exposure lest interest rates rise in a post-QE world. A credit manager can choose to run short duration strategies either in rates duration or credit duration (or both). For the latter, they simply buy shorter maturity bonds. For the former, they can use the full opportunity set and simply hedge the interest rate duration back to a target. Given GMO’s preference for breadth of opportunity set, when running a short duration strategy some years ago we took the latter approach. Exhibit 8 shows the maturity distribution for EMBIG and CEMBIB, breaking out the 1- to 3-year subsegments by notional outstanding. This shows how limiting an “only buy short duration bonds” strategy can be.
Exhibit 8: 1-3 Year Maturity Buckets Relative to Overall EMD Benchmark Indices
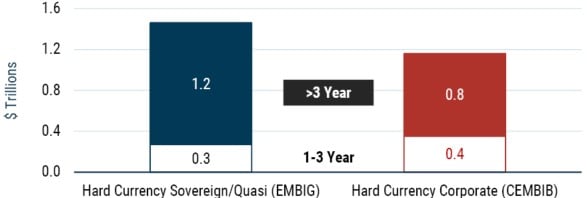
As of June 30, 2024 | Source: BofA Global Research, BIS, Bloomberg
Dual (ESG, or Environmental, Social, and Governance) objective strategies have been introduced mainly in the European market to satisfy SFDR regulations (Article 8 and 9 funds). 16 Here, the manager seeks a performance objective and an E- or S-related promotion objective. These are achieved through improved ESG portfolio scoring (using internal or external scores), via limits or exclusions to extremely poor-scoring issues, and/or through the monitoring and reporting of engagement with bond issuers. An important insight we gained when integrating ESG factors into our sovereign risk assessments was that ESG promotion performed in these ways is mostly correlated with higher quality (regardless of price) due to the very high statistical relationship of ESG scores and sovereign credit worthiness. Regulations, and therefore investor and manager expectations, are evolving rapidly in this space. Currently we manage mostly single-objective (performance) strategies, although we are open to discussions about dual-objective mandates for clients. Based on client conversations, we’ve developed the two thematic strategy ideas discussed below.
Thematic strategies are relatively new and are designed to profit from or express a theme regardless of SFDR rating. Last year we wrote about a freedom and democracy theme, where the objective was to earn a return consistent with EMBIG-D while excluding and limiting countries with poor freedom and democracy attributes. More recently, we wrote about profiting from the energy transition plans of emerging countries, where a $7 trillion funding gap can be filled by return-seeking investors. Our team would be delighted to speak with you about any of these.
When Should One Invest in Emerging Debt?
GMO goes to great lengths to assess the value of an asset class, whether by our Asset Allocation team, who publishes GMO’s 7-Year Asset Class Forecast, or within our own team by assessing fixed income relative value. We also publish the aforementioned Quarterly Valuation Update for emerging debt, in which we use rigorous techniques to compare market pricing to aggregate fundamentals of EMBIG-D and GBI-EMGD. We use the output of this publication regularly in our conversations with clients about the outlook for the hard and local currency asset classes. Occasionally, when the data support a notable conclusion, we separately highlight that, as we did earlier this year with local currency debt.
For hard currency we mainly assess the credit spread, comparing it with expected losses due to defaults. For local currency we compare the currency carry of FX to aggregate currency fundamentals used in our currency alpha processes. Similarly, for local currency interest rates, we compare the term structure to aggregate fundamentals used in our interest rate alpha process. It’s our most widely read publication, and a technical appendix detailing the methods we use is available upon request. Our clients appreciate that as an active manager we deliver an outlook based on rigorously assessed valuations.
Our GMO Fixed Income colleagues have built out analogous metrics for other credit asset classes, including IG, HY, and structured credit, for use in muti-asset credit portfolios.
What Is Emerging Debt?
Defining Terms
First, some confusing terms exist in this space. What does it mean to be an emerging market in fixed income? It depends a bit on whom you ask.
If you ask the IMF or World Bank, an “emerging and developing country” is one that has not achieved “advanced country” status. 17 Per the IMF and World Bank, “advanced economies” include euro-area countries, “major advanced economies” (the G7, 18 including overlap with the euro area), “other advanced economies” (notably Hong Kong, Israel, Korea, Singapore, and Taiwan), and the “ASEAN-5” (Indonesia, Malaysia, Philippines, Singapore, and Thailand). The remainder are termed “emerging and developing countries.” Meanwhile, if you ask the emerging debt market sell-side participants, they will include all non-G7/euro-area countries in their tabulations of market size but may not include certain markets in their bond benchmarks (more on benchmarks later).
Given how advanced some emerging countries have become over the years, the current crop of less developed countries is sometimes referred to as frontier.
Hard currency (also known as “external”) emerging debt markets are those that are denominated in major reserve currencies (USD, EUR, JPY, GBP, and CHF), while local currency emerging debt is denominated in emerging market currencies. Either hard or local currency debt can be external debt or domestic debt, depending on whether its documentation/legal regime is foreign (U.S. and U.K. are most common) or domestic. In other words, you can have a local currency denominated bond issued in foreign markets under foreign law (aka global local currency bonds), and you can have hard currency denominated bonds issued in domestic markets. For foreign investors, foreign law bonds typically offer greater creditor protection than domestic law debt.
There can also be some confusion about what’s meant by corporate EM debt. Generically, corporate EM debt is debt issued by corporations rather than sovereigns. State-owned-enterprise (SOE) debt is debt issued by fully or partially owned government companies. For example, when Saudi Aramco debuted its issuance in 2019, it was 100% state owned. Since then, Saudi has privatized a small fraction, although it’s still nearly a 100% SOE. Quasi-sovereign is an investment term of art, where the asset manager determines that the issuing corporate entity or an instrument or issue itself (project finance, loan, etc.) has a high likelihood of receiving assistance from its parent country or a parent country SOE if needed. For quasi-sovereign issues, the stand-alone credit profile of the issuer is enhanced by this support likelihood, coupled with the financial strength of the parent country and/or SOE to help it out. GMO specializes in identifying and capitalizing on mispriced quasi-sovereign issues.
Market Size and Structure
Bank of America estimated the total size of tradable emerging debt markets at $42 trillion at year-end 2023, representing 26% of total global debt. 19 As detailed in Exhibit 9, domestic local currency debt ($37 trillion dominated by China/Asia) dwarfs the hard currency debt market ($4.6 trillion), though the hard currency debt market is more geographically diverse.
Exhibit 9: Market Structure of Tradable Debt
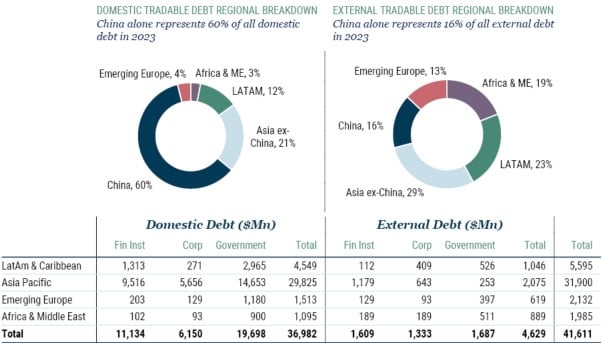
As of June 30, 2024 | Source: Bank of America
Benchmarks
The most widely used benchmarks in emerging market debt are the three produced by J.P. Morgan: the Emerging Market Bond Index Global (EMBIG), the Government Bond Index Emerging Markets Global (GBI-EMG), and the Corporate Emerging Market Bond Index Broad (CEMBIB). Each of these has diversified versions that cap exposures to large countries (i.e., EMBIG-D, GBI-EMGD, and CEMBIB-D).
J.P. Morgan launched the Emerging Markets Bond Index in 1992, 20 which over time has evolved into EMBI Global Diversified (EMBIG-D), today’s benchmark for sovereign and quasi-sovereign USD emerging debt markets. 21 At 6/30/24, it had 972 bonds from 70 countries and 84 quasi-sovereign issuers. EMBIG represents $1.46 trillion notional ($1.24 trillion market value) of bonds. 22 Under EMBIG’s definition, a quasi-sovereign must be 100% state owned or the bonds need to be 100% sovereign guaranteed. Thus, the aforementioned issuer, Saudi Aramco, debuted in EMBIG in 2019 when it was 100% government owned, but migrated to CEMBI in 2019 after the limited 2% privatization.
Local currency debt only became diversified enough by country in the 2000s, and J.P. Morgan launched the GBI-EM suite in 2005. 23 Three versions (replicable, investable, and broad) reflect a foreigner's ability to access the “EM,” “Global,” and “Broad” markets, respectively, each with “Diversified” versions that cap exposure to the larger countries. Most local currency debt managers use the GBI-EM Global Diversified. At 6/30/24, it had 375 bonds from 20 countries representing $4.06 trillion in market value ($4.04 trillion par value).
Finally, as countries built out their hard currency sovereign curves, domestic corporates began issuing hard currency bonds as well. This universe became broad enough in the 2000s such that J.P. Morgan introduced the CEMBI benchmark in 2007. At 6/30/24, the Broad version of CEMBI included 1779 bonds from 724 issuers spanning 59 countries, with a total par value $1.16 trillion of and a market value of $1.09 trillion. From an investment point of view, we note that of the 724 issuers, around 300 qualify as quasi-sovereign corporates (i.e., they are either state-owned or are likely to receive state support). Investing in EM corporates takes specialized skills given the legal and other complexities of the instruments and issuers involved. Note also that there is not yet an index for local currency denominated EM corporates (SOE or otherwise), but they exist in size, mainly in Asia and CEEMEA.
Note that country coverage differs when talking about EMBIG vs. GBI-EM or CEMBI. EMBIG imposes an income cap on countries (GDP per capita), and countries can graduate out of EMBI (as Korea has) or fall into it (if GDP per capita falls sufficiently). Or, in 2019, J.P. Morgan tweaked its GDP rules to include the high-income GCC countries (namely Saudi Arabia, Kuwait, U.A.E., and Qatar). For GBI-EMGD, what’s important is accessibility by foreigners to invest in local markets, and currently Saudi Arabia and the Philippines are under consideration for addition, and the large Indian market was just added. In CEMBI, J.P. Morgan takes the most expansive country definition, including issuers from all “non-advanced” economies.
Looking at these figures, it’s clear that these benchmarks are hardly comprehensive. Exhibit 10 shows just the tradeable debt covered, comparing J.P. Morgan’s index figures to BAML’s total size figures. Beyond this universe lies loans and other private securities that we believe offer excellent opportunities from time to time.
Exhibit 10: Index Coverage of Tradable EMD Universe
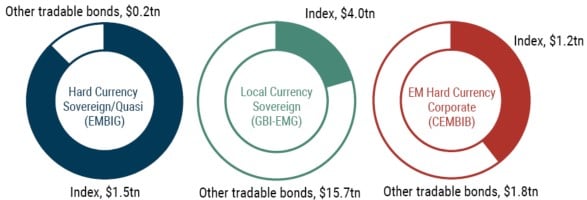
As of June 30, 2024 | Source: GMO calculations based on data from J.P. Morgan, Bank of America
History of EMD and GMO’s Experience
Modern emerging debt markets got their start in the late 1980s with the restructuring of defaulted sovereign bank loans into tradable hard currency bonds (“Brady bonds”). These were extremely complex financial instruments, making the accurate assessment of relative value a huge advantage. GMO’s edge since beginning in 1994 has been focusing on relative value among complex instruments, a unique feature of emphasis among asset managers. As one of the earliest active managers in the space – including team members who in prior roles were at the birth of the asset class – we have been at the forefront of every evolution (and recycling!) of instrument complexities in the emerging debt marketplace. We’ve invested in all kinds of debt instruments over the years in our quest for issue-selection alpha: complex bonds, loans and other private credit instruments, derivatives, asset-backed and project finance securities, warrants, macro-linked bonds, bonds with embedded collateral, call and put features, zero and step-up coupon bonds, bonds that capitalize or amortize, fixed/floating/mixed bonds, etc. We’ve invested in all types of currencies – hard (USD, EUR [and antecedents], JPY, GBP, CHF) and local (deliverable and non-deliverable; floating rate and managed). You name it, we’ve analyzed it – and we get great joy from harvesting alpha from unusual instrument features.
Over the years we’ve published numerous papers with observations on the asset class, using our investment approach as a lens to examine various evolutions. For example:
In sovereign debt markets, even though over time more than half of the asset class has been investment grade, much of the most interesting activity revolves around defaults and workouts. As an investment matter, we’re skilled at managing and hedging default risks, a major focus of our strategies given that negative returns from unhedged defaults are permanent rather than mark-to-market losses. Doing so allows us to be invested in defaulted securities as they recover, often working on creditor committees to maximize recovery. As a long-term investor in this market, the countries welcome “real money” investors like GMO on these committees, as we take more constructive, co-operative, and long-term approaches to debt restructurings. This is very different from general distressed investors (called “vulture” investors by the countries), who buy deeply discounted defaulted debt and use detailed legal techniques to pressure the countries into making quick settlements for their profit. The case of Eliot Management vs. Argentina, which lasted from 2002 until 2016, became the cautionary tale of such tactics, renewing calls for an international bankruptcy court for sovereigns.
As part of our experience on these periodic restructurings, we’ve written about China’s increasing role as a creditor in our markets; about novel debt instruments the sovereigns can use; and about the varied outlooks for the bumper crop of pandemic- and war-related defaults of 2020-2022. With the war came a new risk to EM debt investors: U.S. and allied country sanctions that prevent us from receiving payment on bonds, and we wrote about estimating and navigating such risks.
In corporate markets, we’ve written extensively on why we have a preference for quasi-sovereign corporates, both in general and for China (the largest corporate market) in particular. Although all corporates are part of our investment universe, our preference for quasi-sovereigns has helped us navigate tricky markets, sidestepping things like Chinese real estate and corporate frauds.
We haven’t written extensively about our currency strategies or our local interest rate strategies, although the technical appendix to our Quarterly Valuation Update does contain high-level details about how they’re used to create aggregate GBI-EMGD valuation signals. Different from other strategy elements, our main FX and local interest rate processes are fundamentally based, quantitative strategies that effectively operate in the EM subsegment of the global macro space. Our edge is in identifying drivers of core, floating rate currencies and their associated interest rate markets, and we regularly meet with our investors to discuss current drivers in any market environment. Further, we assess pegged and managed currencies in a separate framework that seeks to identify when such currencies are likely to out- or underperform their forwards. Given the high IRs of these strategies, we use them both as alpha streams in our local currency debt strategy (for approximately half of the alpha), and also as absolute return strategies in other vehicles and contexts. Over the nearly 20 years that we’ve managed EM local market debt, we have adapted and refined these quantitative processes as the drivers of EMFX and rates evolve.
Finally, just ahead of the pandemic we were fortunate to be part of GMO’s extensive efforts to harness the burgeoning availability of detailed, granular ESG data. We found integrating this into our sovereign and quasi-sovereign corporate risk assessment processes both challenging and rewarding – and we were a finalist for a 2021 PRI Award in the ESG Incorporation Initiative of the Year category for our efforts.
Our team would be delighted to speak with you about our research and strategies and have included a list of related research, including the pieces we’ve referenced in this guide, below.
Related Research
- Valuation Metrics in Emerging Debt: 2Q24 by ECD Team (July 2024)
- Emerging Debt Energy Transition: Attractive Returns in a Growing Investment Universe by Sergey Sobolev and Mustafa Ulukan (March 2024)
- Emerging Local Debt: A Once-in-a-Generation Opportunity by Victoria Courmes (January 2024)
- Does Democracy Matter for Emerging Market Debt? By Eamon Aghdasi and Mina Tomovska (August 2023)
- Weighing the Risk of Sanctions in Emerging Debt by Carl Ross (June 2023)
- EM Quality Local Currency Debt: Higher Yield and Similar Defensiveness vs. DM Government Bonds by Victoria Courmes, Riti Samanta, and Mina Tomovska (May 2023)
- The Many Faces of Sovereign Default by Carl Ross (March 2023)
- Sovereign Contingent Bonds: Two Years Later, Still a Useful Idea by Carl Ross and Mustafa Ulukan (October 2022)
- No Stone Unturned: Exploiting the Full Breadth of Opportunity across Emerging Market Debt by Victoria Courmes and Tina Vandersteel (June 2022)
- Sovereign ESG Integration: An Alpha-Oriented Approach for Emerging Debt by Eamon Aghdasi (March 2021)
- Chinese SOE Debt: The Mystery of SOE Debt Update by Mustafa Ulukan and Sergey Sobolev (February 2021)
- The Mystery of SOE Debt: A Unique and Growing Opportunity by Mustafa Ulukan and Sergey Sobolev (September 2020)
- Sovereign Contingent Bonds: How Emerging Countries Might Prepay for Debt Relief by Carl Ross and Mustafa Ulukan (August 2020)
- Gaming Out Sovereign Default When China Is a Major Creditor by Carl Ross (July 2019)
- Closing the Gulf: How the GCC Countries Fit into Our Emerging Debt Investment Process by Carl Ross (April 2019)
Download article here.
While we have used U.S. corporate high yield for this analysis, a similar comparison can also be made for global corporate high yield.
For this publication we’ll assume USD funding. In our Quarterly Valuation Update, we provide information on carry and fundamentals when translating USD-numeraire investments into AUD, EUR, etc.
Note that in both FX and bond value determination we’re relying on our own GMO estimation techniques, which add some imprecision (particularly as GBI-EMGD is not itself very diversified by country) and therefore uncertainty. It’s for this reason we recommend valuation-based allocations when these techniques reveal fairly unambiguous results, as we’d argue they are doing now for the first time in a generation
Available from your GMO representative.
For more, see The Meb Faber Show Episode #521: GMO’s Tina Vandersteel on a “Once-in-a-Generation” Opportunity (Feb 2024).
At June 30, 2024, the largest hard currency passive ETF, EMB, had $14.9 billion AUM and a total expense ratio of 39 bps. The largest local currency passive ETF had $3.5 billion AUM and a total expense ratio of 50 bps (Bloomberg).
While we have used the Bloomberg U.S. Aggregate Index for this analysis, a similar comparison can be made for the hedged Bloomberg Global Aggregate Index.
Practically speaking, apart from Greece in 2012, other sovereign defaults are from countries considered to be emerging.
J.P. Morgan Global ETF Handbook (June 2024).
We believe ETFs can be useful for managing tactical EMD exposures, however. Under normal circumstances, the large hard currency debt ETFs have low price bid/offer spreads (1-2 bps) relative to total return swaps on their underlying, reduced-form (EMBI Core) benchmark (45 bps not including funding) or CDX.EM (6-7 bps). The ETF and its benchmark follow EMBIG-D fairly closely (apart from Venezuela, which is absent from the ETF and its benchmark), while large compositional differences for CDX EM make it a less useful tool. The largest local currency debt ETF also has a higher price bid/offer spread (20-25 bps), likely due to timing of market opening uncertainties, although it tracks GBI-EMGD effectively under normal circumstances.
Bloomberg (August 2024).
This low country diversification feature of GBI-EMGD is another reason to choose an active manager who can navigate such events.
And “Greater China,” including Hong Kong and Macau, adds another 9% to China.
Bank of America (June 30, 2024).
The Sustainable Finance Disclosure Regulation (SFDR) aims to improve the clarity and comparability of sustainability disclosures in financial market participants’ investment policies and products.
Canada, France, Germany, Italy, Japan, the United Kingdom, and the United States.
Size and Structure of Global Emerging Markets Tradable Debt, Bank of America, July 1, 2024.
A fun GMO fact is that Tina Vandersteel, who leads our EMD team, was on the team that created EMBI and later ELMI.
Note the ETFs use “EMBI Core,” a subset benchmark of 595 bonds that are larger and more liquid and therefore more easily replicable at low cost by ETF authorized participants.
EMBIG-D figures are lower due to the benchmark’s methodology, which constrains the notional of larger countries to be no more than twice the average notional of countries in the index, re-distributing such notional to smaller countries. The EMBI series also has a EUR-denominated counterpart that captures €273 billion notional (€246 market capitalization).
Core local currencies began trading more widely in the mid-1990s and were represented by J.P. Morgan’s ELMI (Emerging Local Markets Index), now called ELMI+. Today ELMI+ tracks 22 currencies via currency forwards and money market instruments.
Disclaimer: The views expressed are the views of the Emerging Country Debt team through the period ending September 2024 and are subject to change at any time based on market and other conditions. This is not an offer or solicitation for the purchase or sale of any security and should not be construed as such. References to specific securities and issuers are for illustrative purposes only and are not intended to be, and should not be interpreted as, recommendations to purchase or sell such securities.
Copyright © 2024 by GMO LLC. All rights reserved.
While we have used U.S. corporate high yield for this analysis, a similar comparison can also be made for global corporate high yield.
For this publication we’ll assume USD funding. In our Quarterly Valuation Update, we provide information on carry and fundamentals when translating USD-numeraire investments into AUD, EUR, etc.
Note that in both FX and bond value determination we’re relying on our own GMO estimation techniques, which add some imprecision (particularly as GBI-EMGD is not itself very diversified by country) and therefore uncertainty. It’s for this reason we recommend valuation-based allocations when these techniques reveal fairly unambiguous results, as we’d argue they are doing now for the first time in a generation
Available from your GMO representative.
For more, see The Meb Faber Show Episode #521: GMO’s Tina Vandersteel on a “Once-in-a-Generation” Opportunity (Feb 2024).
At June 30, 2024, the largest hard currency passive ETF, EMB, had $14.9 billion AUM and a total expense ratio of 39 bps. The largest local currency passive ETF had $3.5 billion AUM and a total expense ratio of 50 bps (Bloomberg).
While we have used the Bloomberg U.S. Aggregate Index for this analysis, a similar comparison can be made for the hedged Bloomberg Global Aggregate Index.
Practically speaking, apart from Greece in 2012, other sovereign defaults are from countries considered to be emerging.
J.P. Morgan Global ETF Handbook (June 2024).
We believe ETFs can be useful for managing tactical EMD exposures, however. Under normal circumstances, the large hard currency debt ETFs have low price bid/offer spreads (1-2 bps) relative to total return swaps on their underlying, reduced-form (EMBI Core) benchmark (45 bps not including funding) or CDX.EM (6-7 bps). The ETF and its benchmark follow EMBIG-D fairly closely (apart from Venezuela, which is absent from the ETF and its benchmark), while large compositional differences for CDX EM make it a less useful tool. The largest local currency debt ETF also has a higher price bid/offer spread (20-25 bps), likely due to timing of market opening uncertainties, although it tracks GBI-EMGD effectively under normal circumstances.
Bloomberg (August 2024).
This low country diversification feature of GBI-EMGD is another reason to choose an active manager who can navigate such events.
And “Greater China,” including Hong Kong and Macau, adds another 9% to China.
Bank of America (June 30, 2024).
The Sustainable Finance Disclosure Regulation (SFDR) aims to improve the clarity and comparability of sustainability disclosures in financial market participants’ investment policies and products.
Canada, France, Germany, Italy, Japan, the United Kingdom, and the United States.
Size and Structure of Global Emerging Markets Tradable Debt, Bank of America, July 1, 2024.
A fun GMO fact is that Tina Vandersteel, who leads our EMD team, was on the team that created EMBI and later ELMI.
Note the ETFs use “EMBI Core,” a subset benchmark of 595 bonds that are larger and more liquid and therefore more easily replicable at low cost by ETF authorized participants.
EMBIG-D figures are lower due to the benchmark’s methodology, which constrains the notional of larger countries to be no more than twice the average notional of countries in the index, re-distributing such notional to smaller countries. The EMBI series also has a EUR-denominated counterpart that captures €273 billion notional (€246 market capitalization).
Core local currencies began trading more widely in the mid-1990s and were represented by J.P. Morgan’s ELMI (Emerging Local Markets Index), now called ELMI+. Today ELMI+ tracks 22 currencies via currency forwards and money market instruments.