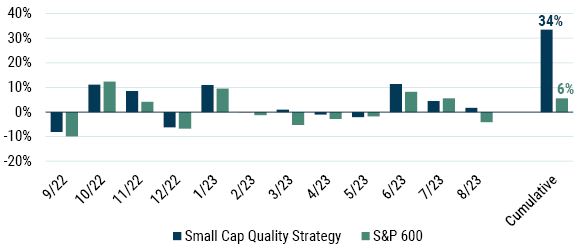
One year ago, we launched the GMO Small Cap Quality Strategy, convinced that it was an opportune moment for our investment approach. The long-term advantages of quality investing in small caps had aligned with a tactical opportunity as small cap quality stocks were trading at unusually attractive valuations. Now, a year later, we can report that our results have exceeded even our most optimistic projections: we delivered 34% net return and beat our benchmark, the S&P 600 by 28%. As we plan for the coming year, we are intently focused on understanding the drivers of our first year’s remarkable results to ensure we are well-positioned to sustain our strong performance going forward.
GMO Small Cap Quality Performance Overview
Exhibit 1: Relative Strategy Performance
Monthly and Cumulative Net Performance
As of 8/31/23 | Source: GMO
During its first twelve months, the Small Cap Quality Strategy delivered strong performance across a wide range of market environments. In the fall of 2022, amid recession fears and inflationary pressures, our most defensive stocks outperformed. In the winter of 2023, we had our strongest period of relative performance as the banking crisis of February and March provoked a broad flight to quality. Despite the S&P 600 falling about 17%, our strategy was flat over the period. During the spring and summer, as fears of both inflation and banking contagion fell and hopes of a “soft landing” rose, our most cyclical stocks enjoyed outsized returns, while our defensive holdings lagged. Although the initial May relief rally proved to be a headwind (as is usually the immediate case with quality in a post-crisis environment) our strategy continued to outperform overall during this period. Throughout the year, we were pleased that our strategy remained defensive: we outperformed on down days, and our realized beta to the S&P 600 was 0.85.
Performance Drivers: Sector and Stock Selection
While our sector selection was favorable, it was our stock picking that accounted for most of our relative performance. In general, our most cyclical holdings performed best this year, especially industrial companies with economic exposure to the construction industry, as the market’s view of housing swung over the course of the year from extreme pessimism to remarkable optimism. Our largest thematic allocation was to building products, which performed well, as the housing market disproved downbeat market expectations. Our allocations to defensive sectors, such as Consumer Staples and Health Care, proved to be among the weaker parts of our portfolio.
Notable, also, was the impact of what we did not hold: we see few quality businesses among regional banks and small cap biotechs, and we drove favorable results by avoiding both these industries, which were dragged down by alarm around bank failures and a tightening of financial conditions. However, our aversion to Energy companies – often leveraged and undifferentiated businesses – was a significant detractor. Similarly, by avoiding the actual homebuilders, we missed the tailwinds they received from the construction economy.
Though we monitor our top-down sector exposures, the core of what we do is bottom-up stock picking. This stock picking delivered over two-thirds of our gains against the benchmark. We found undervalued and misunderstood companies across multiple sectors. For instance, we bought Axcelis (ACLS), a maker of semiconductor capital equipment when it was trading off along with the broader semiconductor industry; the market had not recognized that the company had become vital to the manufacture of silicon carbide chips used in electric vehicles. The market was similarly pessimistic about Saia (SAIA), a trucking company in the attractive “less than truckload” (LTL) business; we believed that the company could sustain its pricing power in a tough freight market, thanks to its improving service levels and the struggles of unionized competitors such as now-bankrupt Yellow (YELL). The New York Times Company (NYT) was never deeply discounted, yet we perceived that market did not appreciate the value it was creating with its new product-bundling strategy.
Sometimes, of course, we were on the wrong side of a market overreaction: Globus Medical (GMED), a provider of spinal surgery equipment, traded off dramatically after announcing a merger with competitor NuVasive, and was thus among our weakest holdings. Though we have some reservations about this deal, the company’s underlying business remains sound, and the market’s excessive pessimism about the stock last year has set it up well to be a future outperformer.
Performance Drivers: Investment Process
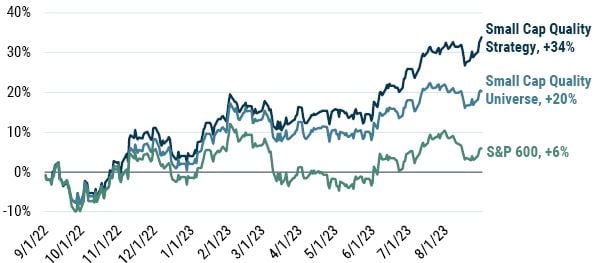
Exhibit 2: GMO Process Performance Year One Net Performance
As of 8/31/2023 | Source: GMO
Another way to look at our performance is through the lens of our investment process. Our strategy combines quantitative and fundamental analysis. This year, both approaches contributed more or less equally to our success. On the quantitative side, we generate a universe of stocks that screen as high quality: stocks with high and stable returns on capital alongside low leverage. This screening methodology has a long history at GMO—the firm pioneered quantitative quality research in the 1980s—and we apply the same quantitative methodology used by our large cap Quality Strategy, ensuring that our small cap process identifies competitively advantaged businesses similar to those we have focused on successfully in large caps. This quantitative small cap quality approach has a strong long-term track record of outperformance against small cap indices, and in fact delivered exceptionally good results in our first year after a period of underperformance during the exuberance of 2020-21.
On the fundamental side, we focus on finding truly high-quality companies within our quantitatively defined small cap universe—companies with sustainable competitive advantages led by management teams that make intelligent investments in high-returning opportunities. This focus on finding companies that are genuinely advantaged, as opposed to the apparently solid but actually unexceptional “false positives” common to any quantitative screen, helped to deliver significant outperformance versus our quantitative quality process.
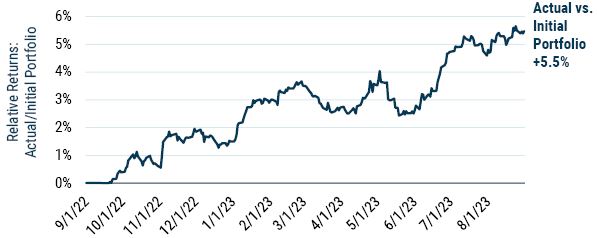
Exhibit 3: Actual Strategy vs. Initial Portfolio at 8/31/2022
As of 8/31/2023 | Source: GMO
We were pleased to find that our portfolio rebalancing added meaningful value through the year. We added over 500 basis points to our returns vs. our portfolio at launch, mostly through additions of attractive new stocks to our book. Where our trades underperformed, this happened largely because we trimmed winners that kept on winning. We have mixed feelings about those missed gains. On the one hand, we don’t want our portfolio’s returns to be driven by a small number of stocks, especially stocks that – through their outperformance – are becoming the most in-favor and “consensus” stocks as they grow their portfolio weight. On the other hand, we know from our trading analyses that our team has a behavioral bias to sell too soon. In general, our performance would be improved by letting our winners run, an insight we will apply to next year’s trading.
Future Positioning: Valuation
After our excellent first-year results, we are focused on ensuring this strength is sustainable. We think that the key driver of long-term outperformance is owning high-quality businesses at attractive valuations.
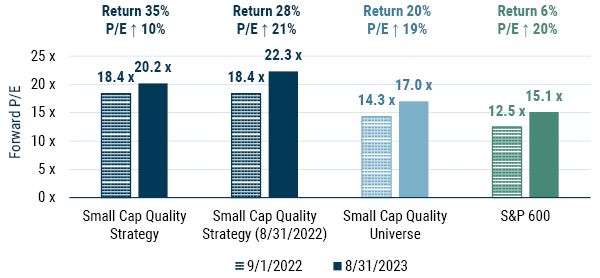
Exhibit 4: Net Returns vs. Change in Forward P/E
As of 8/31/2023 | Source: Worldscope, GMO
We do not hold the portfolio we did at launch. Many of the stocks that performed well for us this year will not be among next year’s winners. As a result, we have re-allocated about half of our portfolio to adjust to this changing set of opportunities. Had we held onto our initial portfolio with no changes, today we would have a portfolio with average valuations rising over 20%. Instead, through disciplined trading into cheaper, out-of-favor companies, we have kept that valuation increase to 10%, meaningfully below the S&P 600’s own upward re-rating.
Though we do not intend to pursue a high turnover strategy, our exceptional outperformance this past year encouraged us to sell out of some of our more extreme relative winners and into a mix of attractive new ideas and some of our portfolio’s relative losers last year. We choose to invest when companies are attractive on quality and on valuation. Quality, if we have assessed it right, changes slowly, and thus should never drive much of our trading activity. But valuations can move as fast as the market wants, and if market moves create exceptional opportunities, we do not fear exceptionally high turnover in responding to them.
Future Positioning: Small Caps
Exhibit 5: U.S. Small Cap vs. U.S. Large Cap
As of 8/31/2023 | Source: Bloomberg, GMO
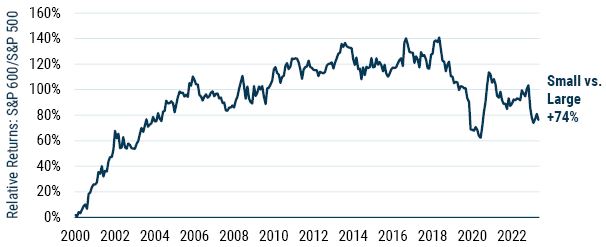
Since we launched our strategy, small caps (S&P 600) underperformed large caps (S&P 500) by 10%, continuing a five-year run of relative weakness. Most of this 12-month underperformance came from the banking crisis earlier this year, and more recently, from the market realizing that long-term yields could remain higher for longer. We launched the Small Cap Quality Strategy last year because the relative valuations of small caps had become remarkably compelling. We think this year’s relative weakness has made them an even more attractive bargain.
Exhibit 6: U.S. SMALL CAP QUALITY VS. U.S. SMALL CAP
Data from Dec 1976 – Sep 2023 | Source: GMO
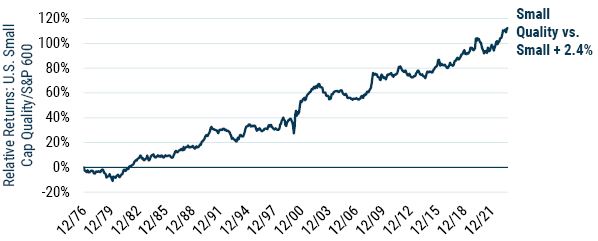
GMO defines U.S. Small Cap Quality as U.S. companies in the bottom decile of U.S. market cap that are in the top quartile of GMO’s global all-cap quality score.
Strategically, the case for quality investing in small caps remains sound. We believe that in small caps, the market continues to overvalue lottery tickets and long-term losers, ignoring the value of strong-and-steady companies and creating an opportunity for us to continue delivering strong results by buying the best businesses at reasonable prices.
Conclusion
As we look forward to our second year, we believe that our portfolio is well positioned to succeed. We own great businesses, and we have not paid an excessive premium for them. Furthermore, our portfolio positions have been refreshed; where the market got overenthusiastic, we sold, and where it became overly pessimistic, we bought.
We expect that our approach of choosing companies that are both fundamentally and quantitatively screened for quality, at reasonable valuations and across a diversified group of industries, will lead to sustainable outperformance in small caps. Our first year was a strong proof point for our strategy. We are optimistic that next year can be one too.
Download article here.

