Executive Summary
In this piece, we attempt to answer a number of questions we have gotten from clients about the impacts that rising levels of passive investing may have had on the stock market. While it is extremely difficult to make conclusive statements about the impact of passive investing, we use our understanding of how stock markets and investors behave to reach some reasonable tentative conclusions. It seems plausible that the increasing share of passive investing might have helped intensify a few features of today’s markets – notably the rise of the mega-cap stocks and the underperformance of value and small caps. But any effect was likely quite small, and passive investing cannot change the basic math of investing in the long run. If passive investing helped push up the prices for mega-caps or push down the prices for other stocks in a way that was not justified by their underlying fundamentals, future returns will be better for the undervalued stocks and worse for the overvalued ones.
Introduction
This has been one of the hardest quarterlies to write that we can remember. 1 One way you can tell is the fact that it is late, even by our pretty relaxed standards of when in a quarter a quarterly letter should come out. For many quarterlies, much of the pain comes during the blank sheet stage of the writing process, when brainstorming what to talk about. In this case, we already had our topic – indeed, we had promised in our last letter that we would talk about the impact of passive investing on the market in our next piece.
The problem has instead come from the dilemma of wanting to say fairly definitive things about the impact of passive investing on the stock market when it is exceedingly difficult to make conclusive statements about the effect of a single market change in an environment in which many other things have also changed over the same basic time scale. We can’t do a control trial in which we rerun recent history with or without passive investing, nor with and without quantitative market makers, nor pod shops, nor private equity, nor the rise of China as a manufacturing power, for that matter. And given that most of these phenomena have arisen over the same broad time scale, even insofar as there have been clear and important changes to the stock market as they emerged, we can’t say conclusively that one or another was the cause.
And yet, the shift to passive has unarguably been one of the most profound changes in the stock market ever, and such an important change surely has had some effects. Moreover, passive is not some temporary investing fad like portfolio insurance or SPACs that is unlikely to be with us in the long term. Passive funds have overtaken their active peers for a very good reason – they are much cheaper than active management. This relative cheapness stems from the fact that active and passive funds have very different returns to scale. Both types of funds have very high fixed costs, and therefore benefit meaningfully from increases in size. Active funds, however, have capacity constraints; as AUM grows, a fund’s market impact can overshadow the inefficiencies that allow it to make money in the first place. This, combined with the significant ongoing research effort that passive funds don’t require, places a (relatively high) floor on how low fees can go. Passive funds make no claim to outperformance, have no capacity constraint, and therefore in the limit can decrease fees until they reflect the fund’s marginal cost of running an additional dollar. In a competitive marketplace, passive fees will be lower.
As a result, passive is not going away and will probably continue to grow (although we will argue a little later on that it may well grow more slowly than it has to date). So, in this piece we are going to look at five questions about the impact of passive investing that we have been getting from our clients and asking of ourselves. While we can’t claim to be utterly certain in our attempts to answer them, we do believe we can come to some reasonable conclusions based on the nature of how stock markets and investors behave. The questions are:
- Has the rise of passive investing affected market efficiency?
- Is the increase in passive investing behind the rise of today’s mega-caps?
- Is the increase in passive investing hampering the performance of small cap and value stocks?
- Is mean reversion slower in the presence of passive investing?
- Does passive investing create opportunities for active investors?
Market Efficiency
In our experience, market efficiency comes in different flavors. It is almost certainly the case that equity and fixed income markets have become more informationally efficient over the last couple of decades, a result of technological progress, the widespread adoption of statistical analysis, and the proliferation of data. It is also almost certain that the growth in passive investing has little bearing on the increase in the speed and precision at which new information gets incorporated into prices. In fact, informational efficiency requires active investors. In order for stock prices to incorporate new information, investors must change the price at which they are interested in buying or selling those stocks. Passive investors are inherent price takers – they buy or sell only when cash flows in or out require it, and they do so at whatever the prevailing price is. If Nvidia has a blow-out quarter or disappoints dreadfully, an index fund’s opinion of it does not change. Any change in Nvidia’s share price that is driven by news relevant to Nvidia is driven by active investors. Whether they are traditional long-only managers, multi-strategy pod shops, high-frequency market makers, or retail day traders, any investor who changes their mind about the price they are willing to pay for a share of Nvidia in response to information is definitionally active.
This does not mean the relative growth of passive hasn’t changed other aspects of market efficiency; the rise of passive investing could, in theory, lead to either a decrease or an increase in exploitable market opportunities. If the people quitting active management were inattentive gamblers with a propensity to pour their life savings into brand names that made them nostalgic, remaining active participants would no longer have these lovely counterparties. On the other hand, if the move to passive was primarily from trained forensic accountants with a penchant for uncovering fraud, markets would become more inefficient, with Wirecards and Enrons cropping up more frequently. There is clearly a greater financial incentive for individuals who systematically lose money to make the switch to passive than for those with a demonstrated track record of success. It isn’t obvious that they do (see Exhibit 1). 2
Exhibit 1: Market Moving News

As of 5/13/2024 | Source: x.com
A large part of the growth in passive investing in the U.S. probably stems from the switch from defined benefit to defined contribution retirement plans (as can be seen in Exhibit 2). In a defined benefit scheme, a public or private institution contributes to a fund on behalf of its employees, investing this money (often through contracting various active managers) to fund future retirement payments. The company is guaranteeing payments to retirees and is incented to try to reduce the cost of doing so by improving the returns they earn on the assets they set aside against that future liability. Corporate pension managers tend to be trained financial professionals who believe themselves to be good at finding talented investors. Some are and have the track records to prove it. But even those who are not are generally incented to try, since the most obvious way to show how valuable you are to the company is by demonstrating how much money you have saved them by astutely hiring extraordinary managers (or delivering excess returns from an internally managed security portfolio).
Exhibit 2: DB/DC Split of Retirement Assets
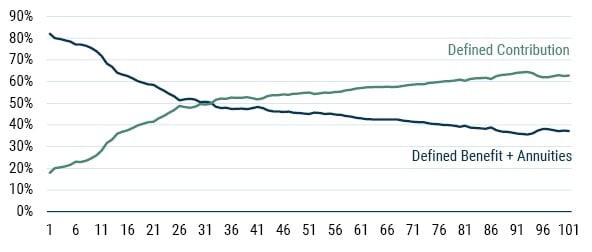
As of 12/31/2023 | Source: Investment Company Institute
In contrast, in a defined contribution plan, employees receive (and make) payment in a tax-advantaged account that they themselves are entitled to manage. Here the incentives for the corporation are very different. Any excess returns delivered by active managers that they astutely place into the plan accrue only to participants. While the plan participants would presumably be happy to receive those higher returns, what is much more salient to the sponsoring corporation are the implications should those active managers underperform. In that case, the sponsor runs the risk of participants suing them for their perceived incompetence. Defined contribution plans tend to be managed by committees of HR and legal staff, usually with the help of a specialized pension consultant and an overarching goal of minimizing the chance of getting sued. As it is incredibly difficult to successfully sue over being placed in a cheap passive index fund, it is little surprise that the overwhelming direction of flow in the defined contribution space 3 is to passive strategies, automatically directed to shift over time with employee age (through target date funds). And not only does most of the money in defined contribution plans flow into passive investments, but most plan participants are happy to remain passive in their asset allocation, seldom altering their investments over time or in response to market events (as can be seen in Exhibit 3).
Exhibit 3: % Plan Participants Changing Asset Allocation
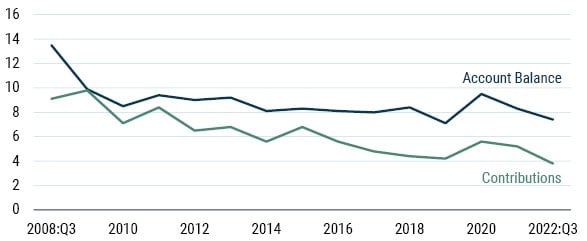
As of 12/31/2023 | Source: Investment Company Institute
This flow of retirement assets from active to passive managers is only of consequence to market efficiency if active managers were price- and information-sensitive to begin with. At the macro level, this is almost certainly the case: the asset class mix of active portfolios has historically responded to asset prices. The same cannot be said of passive target date funds, which by construction wholly disregard fluctuations in real bond yields and equity valuation ratios. It is telling that – if not for aging – an investor in such a fund would have had the same equity allocation whether in March of 2009 or March of 2024 despite the equity risk premium differing radically across the two periods. Micro efficiency – how readily information is absorbed within asset classes – has possibly also changed. The manner and extent to which it has depends on which active managers have been passed over, what assets they would have held a different stake in versus passive funds, and how much the rise of passive has changed the behavior of the remaining pool of active managers in each asset class. We will delve into this in some detail in the next few sections, but the answer is murky at best.
Whatever the impact of passive investing on market efficiency to date, it is likely to be smaller going forward. The transition to defined contribution is coming to an end. Defined benefit plans (and annuities) have already gone from making up 82% of retirement assets in 1974 to 37% of those assets in 2023, and two thirds of what remains in defined benefit plans are in government-sponsored plans (which tend not to be reallocated). While passive may continue to grow as a fraction of assets outside the pension arena, the profound incentive shift that occurs when assets move from defined benefit to defined contribution is absent. Endowments, foundations, and active retail investors are likely to switch from mutual funds to passive vehicles to make use of liquid, cost-efficient vehicles. But unlike retirement accounts, they are not becoming unconcerned about prices or information when doing so; they will still actively change their asset class mix. If future increases in passive flows have less bearing on the size of passive investing, their impact on market efficiency is likely to be muted.
The Rise of the Mega-Caps
In our last Quarterly Letter, we spoke at length about increasing market concentration in U.S. equities and its impact on active managers. We did not dwell on the reason for the relative size of these companies, mainly because it isn’t a particularly interesting story. The primary driver of the enormous market caps of the Magnificent Seven (Spectacular Six? Fabulous Five?) is – drum roll – the enormity of their EPS growth. Exhibit 4 makes this apparent.
Exhibit 4: Enormous EPS Growth Drives Enormous Market Caps
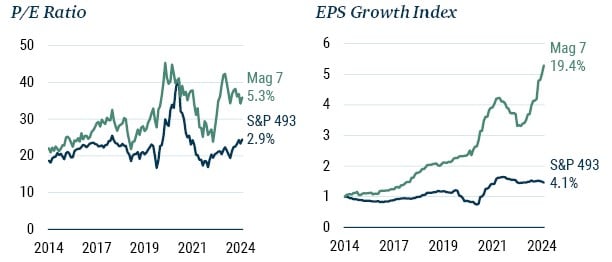
As of 5/31/2024 | Source: Compustat, Worldscope, S&P Global, Bloomberg, GMO
Fundamentals notwithstanding, some market participants believe that today’s mega-caps have been genuine beneficiaries of the rise in passive investing. This belief implies at least one of two things:
- There was a greater positive demand shock for mega-caps than for other stocks.
- The price elasticity 4 of mega-caps is inherently lower than that of other equities.
The first argument hinges on where passive flows came from. If these inflows were mainly funded from equities to begin with, mega-caps could have on net received a demand tailwind if the active funds sold to make way for passive had been systematically underweight mega-caps. Given that in aggregate active participants own the market, this is only possible if passive flows were primarily coming from institutional active managers (as opposed to the other big active subset: retail), who are known for being systematically underweight mega-caps to make room for their active bets. 5
If passive flows came primarily from other asset classes (as opposed to being funded from equities), the money flowing into stocks probably went into funds that track investable market cap-weighted indices. An investor buying into such an index fund would purchase the same fraction of each company in the index irrespective of size. 6 This means that the demand shocks these companies experienced were to a first approximation the exact same. The only way for mega-caps to be impacted differentially is if their existing shareholders are consistently less tempted to sell their holdings than the shareholders of large caps.
They might be. As we have already noted, institutional active managers are on average underweight mega-caps, especially in markets that are concentrated to begin with. 7 Insofar as a significant portion of these managers has risk limits that cause their underweights to be capped for any single stock – something which could arise directly from (benchmark-relative) position limits, 8 indirectly through tracking-error constraints, or implicitly through a manager’s career incentive to not get caught wrongfooted betting against what the marketplace broadly judges to be “magnificent” – mega-cap stocks should indeed have lower price elasticity than mere large caps. Since an asset with a smaller pool of willing sellers sees prices rise more to accommodate passive demand, it stands to reason that mega-caps might indeed rise more as a result of passive flows than your average company.
That said, we should not fall into the trap of giving excessive weight to subtle arguments. The reality is that subtlety is subtle for a reason; it suggests second-order importance. The stock market’s current market cap concentration is mostly a reflection of similar concentration in company profits, not of risk constraints and agency concerns. The impact of price-insensitive dollars coming into equities from cash is of more relevance to the rise in broad valuations than to intra-equity differences. The gap between the performance of mega-caps and everyone else that we cannot explain with fundamentals alone is quite small, and even there passive has not been the sole contributor. Which brings us to subsets of the equity market where passive might actually have played a bigger role.
Slaughtering Small, Murdering Value
It is natural for passive investing to be touted as an explanation for the long winter of small caps and value stocks. For small companies, it is sufficient to note that the most popular passive funds generally don’t contemplate the broad equity market. The smaller you are, the larger the chance of your stock being ignored. The typical argument for value, in turn, rests on the observation that traditional active investors lean toward value companies. If allocators and individuals substituted the portfolios run by these investors for passive indices, a negative demand shock should have taken place for value relative to their growthy peers. 9 The problem would then have been compounded by the underperformance of the factor leading to greater outflows from the active managers who invested in them.
The argument for small caps is patently true. For value, it is weaker. Though value-oriented funds have suffered greater outflows than either growth or core funds, it is hard to make the case that these flows were caused by the rise of passive investing. If outflows from these styles were prompted by poor relative performance unrelated to passive to begin with, they would have occurred whether passive funds were available or not. Passive, in this circumstance, would only have mattered insofar as it increased the marginal propensity of investors to sell out of their value and small cap funds.
But price elasticities – which we have spoken about for mega-caps – also play a role with value stocks. If a passive fund comes along wanting to buy shares in every publicly listed corporation, its price impact should be lowest among companies whose shareholders are prone to selling in reaction to an increased bid. Value investors are definitionally reactive to increased bids; they are the investors most likely to focus on price targets and on maintaining a margin of safety. In the presence of inelastic (read: price-insensitive) buyers, their thrift might perversely turn from virtue to vice. 10
An indirect appraisal of this effect suggests that it is present. If value investors are more price-sensitive than their growth-oriented competitors, the relative valuations of value vs. growth should have become more volatile with the rise of passive. This in turn means that the value-growth spread should look less volatile in areas of the market that have seen comparatively less interest from passive funds – such as smaller firms. To test this, we form value and growth portfolios within each size quintile of the market. We then measure the relative valuations of value and growth within each size band and the volatility of their spreads over two separate periods: pre-passive (1983-2003)and post-passive (2003-2023). Exhibit 5 confirms that value’s relative valuations have grown more volatile within U.S. large caps and less volatile within U.S. small caps.
Exhibit 5: Volatility of Valuations – Value vs. Growth
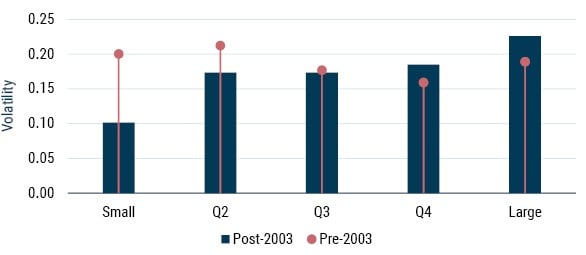
As of 5/31/2024 | Source: Compustat, Worldscope, MSCI, Bloomberg, GMO
Value’s underperformance since 2017 came primarily from unrealistic growth expectations forming for a broad swath of the U.S. stock market. But passive flows clearly did nothing to help matters, especially within large caps. Still, it is not all bad news when it comes to passive and value. Value companies look remarkably cheap today in comparison to the broad U.S. market, and passive has helped make them cheaper. Beyond that, their relative elasticity cuts both ways: while there are more willing sellers of value on the upside, there are equally more willing buyers of value on the downside. As 2022 showed, that is not a feature growth stocks can boast of.
Slowing Mean Reversion
One of the core tenets of GMO’s 7-Year Asset Class Forecasts is that assets with underlying cash flows have a fair value, where fair value is a function of both an asset’s expected cash flows and its required rate of return. If the asset is more exposed to systematic risk – doing poorly precisely when asset owners value returns the most – investors will wind up requiring a risk premium (i.e., a higher required rate of return) to hold it. This is why, for one, equities tend to outperform cash and bonds over the long run.
If you believe that the risk premium required from different asset classes is roughly constant, then you will observe (as Robert Shiller did) that prices often move far more than, and therefore away from, fair value. Our forecasts contend that they won’t do so forever; that asset prices revert, if sometimes slowly. The reasoning is simple: if prices are higher than assets’ discounted cash flows, those assets won’t be able to deliver on their required rates of return, leading disappointed investors to sell out of them. 11 Conversely, if prices are lower than discounted cash flows, asset returns will surprise on the upside, attracting investor purchases. All of which begs the question of why prices aren’t always at fair value to begin with.
Focusing on equities, the simplest answer is that investors’ cash flow expectations can change a lot. In hindsight, we know that these expectation changes have often, especially in aggregate, been wrong. At the time growth expectations are set, however, they often seem quite reasonable. In 1999 it was hard not to get excited about the prospect of the internet expanding companies’ consumer bases; in 2019 it was difficult to question the ability of companies to make services available at almost zero marginal cost through software; today it is easy to see the potential of AI to revolutionize human productivity. Yet we often extrapolate from the high early return on investment of a technology incorrectly; the gains of first adopters of exciting technological advances are often very high (hence the excitement), but the gains of widespread adoption can be quite muted. It pays to remember that in a competitive environment the broad adoption of a cost-reducing technology will generally accrue much more to consumers than it will to shareholders. 12 Exhibit 6 illustrates how the gains from a cost-reducing technology accrue mostly to consumers when competition is present. 13
Exhibit 6: Average Company's Profit Margin Increase from A 50% Cost Reduction
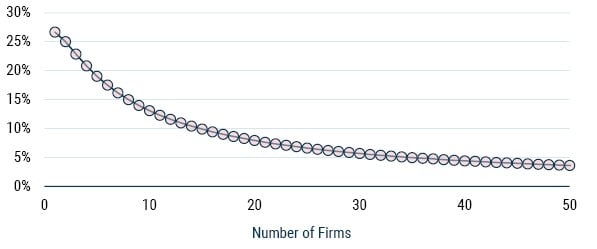
Source: GMO
In practice, most multi-asset investors are well-aware that price changes led by time-varying cash flow expectations are unlikely to be substantiated ex post. This doesn’t mean that they sell out of equities when valuations rise or pile into them when valuations crash. The S&P 500 can trade today at valuations superior to those of 2019 while real interest rates are 2-3 percentage points higher (which might not seem like a lot until you remember that the equity risk premium has averaged about 5% over cash), and most multi-asset portfolios look very similar to what they looked like five years ago. This suggests that the elasticity (read: price sensitivity) of multi-asset investors isn’t particularly high. Some of this is due to tight benchmark constraints, some of it is just inertia.
This low demand reactivity to prices is the main reason for which reversion to fair value occurs slowly (our typical estimate for equities in different regions has been that they close about 1/7 of their gap to fair value every year). If multi-asset portfolios have been substituted for passive target-date funds, moreover, markets should be even less price-sensitive, and reversion should be more lethargic still than it used to be. Though we are open to this possibility, we have yet to find empirical evidence in its favor. We would expect, for instance, that slower mean reversion would translate to a higher amplitude of valuations because of the slower dissipation of flows-driven price shocks. Exhibit 7, which looks at the range of the U.S. market’s total-return-based Shiller P/E over 25-year increments, shows that the recent quarter century has been anomalous only in how reliably high valuations have been.
Exhibit 7: Total Return Shiller P/E Range
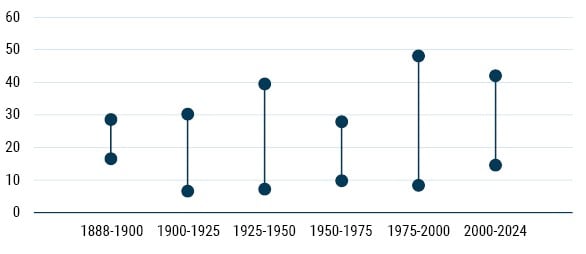
As of 5/31/2024 | Source: Robert Shiller, GMO
The absence of evidence isn’t evidence of absence, especially when we are measuring long-term effects on short time frames. It might still be the case that the rise of passive investing has caused asset-class-level reversion to slow down, particularly in U.S. equities where the presence of passive is most pronounced. If the allocations to passive funds are truly passive – if they don’t shift to other asset classes in response to prices or information – then mean reversion is almost guaranteed to have become a slower process. We on the GMO Asset Allocation team stress-test our portfolios by asking whether our positioning would look different under varied circumstances we find plausible, including slower mean reversion in the U.S. (at print time, they would not). We would suggest other valuation-sensitive investors ask similar questions of their own allocations.
New and Renewed Opportunities in Active Management
We have argued in this letter that the impact of passive investing in markets has been overblown. That said, we do not think it negligible. For one, an increase in inelastic buyers makes for an obvious opportunity in liquidity provision. 14 If an active manager can time when passive flows are likely to meet with illiquidity better than the competition, they can earn a pretty (if not riskless) penny. This is still more profitable if the active manager at hand can estimate the relative elasticity of the extant owners of securities, acting as a liquidity provider where active sellers are scarce. There is of course already an entire (and burgeoning) business around this in markets, much of which comes in the form of index arbitrage.
A corollary of flows having a significant impact on valuations is that valuations don’t have a significant impact on flows. 15 That is why valuation-sensitive investors – such as GMO’s Asset Allocation team – don’t bank solely on mean reverting flows in response to dislocated valuations. Investors like us do enjoy allocating to assets when their discounts are particularly large versus history (such as deep value stocks around the world today), but it isn’t simply because we expect the deep value discount to snap shut. We like wide valuations because they often suggest that an asset is intrinsically cheap – that it can deliver lovely returns on the back of its cash flows alone.
Let’s home in on U.S. deep value stocks: companies in the cheapest fifth of the U.S. market. 16 The fundamentals of these companies – their revenues, gross profits, and book value – have historically undergrown those of the broad market by 5% per annum since 1983. Yet the factor has still delivered 3% above the market per annum over the same period. Deep value stocks have managed to compensate for their undergrowth by delivering higher returns from income (i.e., dividends and buybacks) and especially from valuation-led portfolio turnover (which we call “rebalancing”). We can see this decomposition of returns in Exhibit 8.
Exhibit 8: U.S. Deep Value vs. Rest of Market
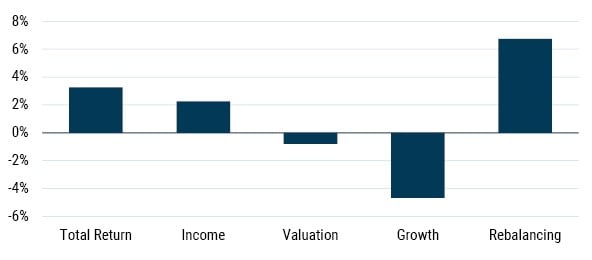
As of 5/31/2024 | Compustat, Worldscope, MSCI, Bloomberg, GMO
The portfolio turnover of deep value occurs on a single-name basis as companies whose bleak prospects improve (a recent example: Meta) graduate from the cheapest quintile, and are replaced by companies whose futures strike investors as much less bright than they used to think (a recent example: Zoom Video Communications). Notice that if passive flows are heavily skewed to non-deep value stocks, this doesn’t much matter for rebalancing. While this would lead us to expect that the wide deep value spread wouldn’t immediately normalize, we would still see cheap companies’ growth expectations shift, with those whose expectation shifted upward seeing their individual valuations shoot up as a result. A lovely consequence of value trading at a large discount is that cheap companies see outsized returns when their future gets re-assessed and they exit the deep value quintile (as depicted in Exhibit 9).
Exhibit 9: Deep Value Exits’ Excess 12M Return (vs Deep Value, %)
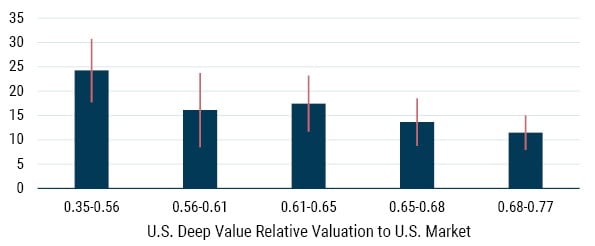
As of 5/31/2024 | Compustat, Worldscope, MSCI, Bloomberg, GMO
Exhibit 9 shows the impact of stocks leaving the deep value universe relative to the rest of deep value. The larger the discount the deep value stocks trade at, the larger the excess return of those former deep value companies that leave the group. When deep value has traded at its tightest spread, exits have delivered 10% excess returns versus deep value as a whole. Conversely, when deep value spreads have been at their widest (that’s today!), the returns to graduating from the group have been over 25%. Since this effect is mechanical, there is no reason to think it will change with the presence of passive investors.
The reality, then, is not so much that the rise of passive investing ruins markets, but only that it changes them. It changes how much short-term investors should care about flows. It potentially changes how much long-term investors should bank on mean reversion. It changes how all investors should think about correlations, seeing as both passive flows and passive allocations might mechanically introduce (or reinforce) sources of asset co-movement. 17 Our responsibility as an active manager is to notice these changes, think of what obstacles and opportunities they create, and make money from them.
Conclusion
As we admitted at the start of this piece, it’s hard to prove the impacts of passive investing on the market with a high degree of certainty. But we were able to use what we know about how the stock market works and how different investors operate to make some claims about plausible effects that passive may have had and what we can expect going forward.
It is important to keep in mind that whatever effects the rise of passive investing has had, it doesn’t change the way that stock investors make money in the long term. The primary drivers of long-term returns in the stock market are the future cash flows of the underlying companies and the prices that investors pay for those cash flows. Passive investing should not meaningfully change those cash flows, barring the conspiracy theories about corporate managers choosing not to compete with each other due to common ownership of the companies. 18 If passive investing does have some lasting impact on prices, those prices impact the timing of returns, not their ultimate level. If the price of the mega-caps was artificially pushed up by passive flows, then those stocks are overvalued and their future returns will be sub-par. If the higher price-sensitivity of the holders of value stocks has led to them trading at too wide a discount to the market as money has moved to passive vehicles, value stocks will outperform in the future. Passive has unquestionably changed the landscape of investing. But it hasn’t changed the math of investing, and at the end of the day it is the math that matters most.
Download pdf here.
At least in terms of aggregate difficulty for those involved in writing it. Ben certainly has had quarterlies which took more personal blood, sweat, and toil, given that John put in the bulk of the toil and no small amount of the blood and sweat. But if we add up the blood, sweat, and toil across the two of us, it’s been a pretty bloody, sweaty effort indeed.
If you did not catch the reference in Exhibit 1, you have the correct amount of regard for social media. It refers to the extraordinary reaction of GameStop stock prices to a tweet by GameStop retail evangelist, @TheRoaringKitty, containing nothing but this image.
We don’t want to come off sounding excessively cynical on this. While passively managed target date funds are not necessarily the ideal retirement investment for employees, they are very far from the worst thing one could think of. There is plenty of evidence that putting participants into these default options and indeed automatically enrolling them into plans in the first place leads to better outcomes than leaving employees to their own devices. But having sat on the investment committees of endowments, foundations, and defined contribution pension plans, we can attest that the overarching goal of the first two is the pursuit of investment excellence and that of the last is the building of a paper trail that demonstrates the committee did not do anything they could be sued over.
The marginal change in demand for the stock as its price rises incrementally. A stock with low price elasticity sees relatively low interest in selling it as its price increases.
A topic we spoke about at length in our last Quarterly Letter, Magnificently Concentrated: Your Active Managers Are More Competent Than They Look (Inker and Pease, 2024).
Well, kind of. The ability to short does make free float an imperfect measure of the available supply of individual stocks. For most companies, and in particular for mega-caps, short interest rarely exceeds 10%.
See footnote 5.
A large active bet on a single stock puts a portfolio in the awkward position of taking large idiosyncratic bets against its benchmark.
The smallest cohorts in the market, which are largely ignored by most passive funds, should have suffered most.
If value investors were purely focused on valuation ranks, there is little reason for this effect to be strong. We would argue a non-trivial portion of value investors is focused on absolute valuations – dipping more into the deep value cohort as broad valuations rise – and that this introduces higher elasticity for cheap stocks.
They can, of course, deliver on those returns by seeing prices rise further away from fair value. But unless market participants are willing to engage in an everlasting game of hot potato, with prices moving infinitely far from fair value, this is bound to lead to ever-more-disappointing returns.
It would be reasonable to push back on this by saying that the market landscape in the U.S. today is much less competitive than it was in the past, and that therefore the broad adoption of a new technology (e.g., AI) might help push up profit margins by more than it would have in the past. This does assume that a broad decline in costs wouldn’t have a positive effect on competition going forward, however.
We set up a Cournot model with a linear demand function and a linear cost function.
While the opportunity is obvious, exploiting that opportunity profitably is significantly less so.
If a stock gets new attention from some investors and this increases its price, then it must be true that insufficient existing shareholders were willing to part with the stock at lower prices.
To try to take advantage of the much larger than normal discounts for these deep value stocks in the U.S. and non-U.S. markets, GMO launched the U.S. Opportunistic Value Strategy and the International Opportunistic Value Strategy in 2022 and 2023, respectively.
The flows argument is direct: one dollar invested in (or divested from) the S&P 500 will necessarily impact all stocks within the index simultaneously. Any two stocks will therefore be more correlated, controlling for all of their characteristics, if they belong to the same index and said index is receiving (or losing) flows. More intriguing, however, is the possibility that passive funds can change asset correlations even in the absence of new flows. The mere heft of target date funds as a fraction of the multi-asset landscape, for instance, should lead bonds and equities to be more positively correlated, given target date funds’ mandate of keeping a pre-defined equity/bond split. If equity prices rally because of blowout Nvidia earnings, all target date funds need to sell out of equities and rebalance into bonds. Understanding these correlation shifts before they happen can at the very least help active investors build portfolios that are more resilient to unanticipated shocks, and ideally can serve to shape actual investment strategies.
One can picture a hilarious and incisive Matt Levine piece on the topic when it turns out that the proposed cage match between Mark Zuckerberg and Elon Musk was in fact a smokescreen to hide the fact that the CEOs of the world’s largest companies had built a giant Telegram group chat and made a pact to avoid competing with each other at the behest of Larry Fink.
Disclaimer: The views expressed are the views of Ben Inker and John Pease through the period ending June 2024, and are subject to change at any time based on market and other conditions. This is not an offer or solicitation for the purchase or sale of any security and should not be construed as such. References to specific securities and issuers are for illustrative purposes only and are not intended to be, and should not be interpreted as, recommendations to purchase or sell such securities.
Copyright © 2024 by GMO LLC. All rights reserved.
At least in terms of aggregate difficulty for those involved in writing it. Ben certainly has had quarterlies which took more personal blood, sweat, and toil, given that John put in the bulk of the toil and no small amount of the blood and sweat. But if we add up the blood, sweat, and toil across the two of us, it’s been a pretty bloody, sweaty effort indeed.
If you did not catch the reference in Exhibit 1, you have the correct amount of regard for social media. It refers to the extraordinary reaction of GameStop stock prices to a tweet by GameStop retail evangelist, @TheRoaringKitty, containing nothing but this image.
We don’t want to come off sounding excessively cynical on this. While passively managed target date funds are not necessarily the ideal retirement investment for employees, they are very far from the worst thing one could think of. There is plenty of evidence that putting participants into these default options and indeed automatically enrolling them into plans in the first place leads to better outcomes than leaving employees to their own devices. But having sat on the investment committees of endowments, foundations, and defined contribution pension plans, we can attest that the overarching goal of the first two is the pursuit of investment excellence and that of the last is the building of a paper trail that demonstrates the committee did not do anything they could be sued over.
The marginal change in demand for the stock as its price rises incrementally. A stock with low price elasticity sees relatively low interest in selling it as its price increases.
A topic we spoke about at length in our last Quarterly Letter, Magnificently Concentrated: Your Active Managers Are More Competent Than They Look (Inker and Pease, 2024).
Well, kind of. The ability to short does make free float an imperfect measure of the available supply of individual stocks. For most companies, and in particular for mega-caps, short interest rarely exceeds 10%.
See footnote 5.
A large active bet on a single stock puts a portfolio in the awkward position of taking large idiosyncratic bets against its benchmark.
The smallest cohorts in the market, which are largely ignored by most passive funds, should have suffered most.
If value investors were purely focused on valuation ranks, there is little reason for this effect to be strong. We would argue a non-trivial portion of value investors is focused on absolute valuations – dipping more into the deep value cohort as broad valuations rise – and that this introduces higher elasticity for cheap stocks.
They can, of course, deliver on those returns by seeing prices rise further away from fair value. But unless market participants are willing to engage in an everlasting game of hot potato, with prices moving infinitely far from fair value, this is bound to lead to ever-more-disappointing returns.
It would be reasonable to push back on this by saying that the market landscape in the U.S. today is much less competitive than it was in the past, and that therefore the broad adoption of a new technology (e.g., AI) might help push up profit margins by more than it would have in the past. This does assume that a broad decline in costs wouldn’t have a positive effect on competition going forward, however.
We set up a Cournot model with a linear demand function and a linear cost function.
While the opportunity is obvious, exploiting that opportunity profitably is significantly less so.
If a stock gets new attention from some investors and this increases its price, then it must be true that insufficient existing shareholders were willing to part with the stock at lower prices.
To try to take advantage of the much larger than normal discounts for these deep value stocks in the U.S. and non-U.S. markets, GMO launched the U.S. Opportunistic Value Strategy and the International Opportunistic Value Strategy in 2022 and 2023, respectively.
The flows argument is direct: one dollar invested in (or divested from) the S&P 500 will necessarily impact all stocks within the index simultaneously. Any two stocks will therefore be more correlated, controlling for all of their characteristics, if they belong to the same index and said index is receiving (or losing) flows. More intriguing, however, is the possibility that passive funds can change asset correlations even in the absence of new flows. The mere heft of target date funds as a fraction of the multi-asset landscape, for instance, should lead bonds and equities to be more positively correlated, given target date funds’ mandate of keeping a pre-defined equity/bond split. If equity prices rally because of blowout Nvidia earnings, all target date funds need to sell out of equities and rebalance into bonds. Understanding these correlation shifts before they happen can at the very least help active investors build portfolios that are more resilient to unanticipated shocks, and ideally can serve to shape actual investment strategies.
One can picture a hilarious and incisive Matt Levine piece on the topic when it turns out that the proposed cage match between Mark Zuckerberg and Elon Musk was in fact a smokescreen to hide the fact that the CEOs of the world’s largest companies had built a giant Telegram group chat and made a pact to avoid competing with each other at the behest of Larry Fink.