Equity Dislocation was designed to profit from the ongoing extraordinary dislocation between value and growth equities. Launched in October 2020, the strategy is 100% long cheap value stocks and 100% short expensive growth stocks. Although the portfolio’s long and short holdings look much different than market indices, the baseline expectation is that when value outperforms growth, Equity Dislocation will deliver positive absolute returns. When value underperforms growth, it is reasonable to expect negative returns. The strategy’s realized performance has far exceeded this naïve baseline.
Since its inception, Equity Dislocation delivered an impressive 55.3% return gross of fees (42.6% net of fees) while MSCI ACWI Value trailed MSCI ACWI Growth by 1.2%. The two series showed similar positive results through the end of 2022. However, since 12/31/2022, MSCI ACWI Value has underperformed MSCI ACWI Growth by an eye-popping 36.2% whereas over the same period Equity Dislocation delivered a positive 10.7% gross of fees (7.3% net). 1
Equity Dislocation outperformed a passive approach by over 40%
Exhibit 1: Equity Dislocation Strategy Since Launch
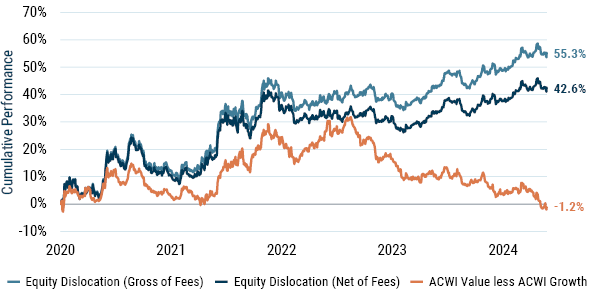
Preliminary data from 10/31/2020 to 6/30/2024 | Source: GMO
Exhibit 2: Equity Dislocation – Cumulative Sources of Excess Return
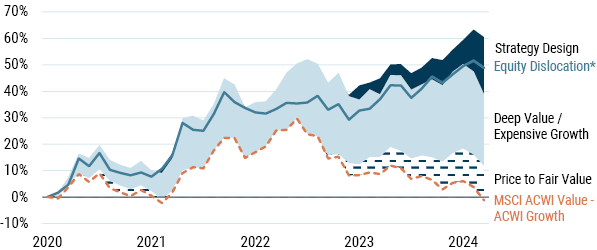
*Gross of fees
Preliminary data from 12/31/2020 to 6/30/2024 | Source: GMO
How has Equity Dislocation managed to deliver such differentiated performance since the end of 2022? Our approach has not changed meaningfully since inception. The difference in realized returns compared to passive value performance can be largely attributed to three sources, as shown in Exhibit 2: 2
- GMO’s proprietary Price to Fair Value model for valuation assessment (+13.1% return)
Equity Dislocation is not simply buying the stocks with the lowest multiples and shorting their high multiple counterparts. We conduct a sober assessment of each company’s fundamentals, including quality and growth potential, to select stocks that are genuinely mispriced relative to their fair value. Two design elements set our model apart:- A better starting point: We have restated the accounting data for every company to generate GMO’s proprietary Economic Book Value and Economic Earnings, which are more closely tied to true fundamentals. For example, we capitalize charges associated with intangible assets and then amortize those expenses at a rate linked to the economic life of the asset.
- Better projections: We use a multi-factor approach to project profitability for each company forward 20 years, including a terminal profitability estimate. Projections are uniquely calibrated to each individual company and incorporate information about quality and growth characteristics from a range of sources.
GMO’s Price to Fair Value metric does a much better job of estimating current fundamental value and future growth potential than traditional indexes, which has been particularly impactful in the strategy’s short book. Equity Dislocation’s short positions have seen their expected book value decline by a cumulative 12% since the end of 2021 as compared to a 22% cumulative gain for MSCI ACWI Growth. Additionally, the growth in forward book value for Equity Dislocation’s long positions has exceeded the growth of book value for MSCI ACWI Value (+27% vs. +19%, respectively); most of that lead has come since the beginning of 2024.
Comparing the price to our estimate of fair value, we sort stocks into cheap and expensive, which is very different from MSCI’s assessment of “value” and “growth” stocks.
Exhibit 3: 1-Year Forward Economic Book Growth
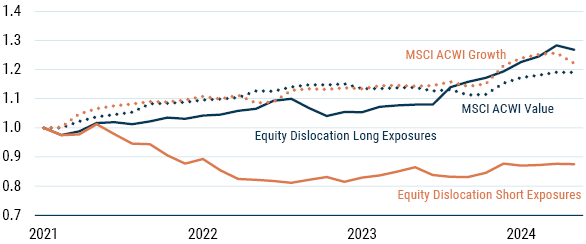
Preliminary data from 12/31/2021 to 6/30/2024 | Source: GMO
Series represent the portfolio-weighted one-year forward growth forecast in GMO’s Economic Book. Forward Economic Book is calculated as current Economic Book plus one-year forward forecast retained earning.
- Deep value and extreme growth rather than broad value and broad growth (+24.2% return)
Once we have our proprietary categorization of stocks, we do not simply buy all value stocks and short all growth stocks. Today’s value opportunity is best captured at the extremes, so we further use our Price to Fair Value model to identify the most severe mispricings: the very cheapest value stocks (roughly the cheapest 20%, or “deep value” opportunities) and the most expensive growth stocks (roughly the most expensive 20%). These segments are particularly misvalued relative to history and are best positioned to generate excess returns in a reversion scenario. Consequently, Equity Dislocation concentrates capital into the best opportunities as identified by the Price to Fair Value model and allocates little capital to companies that are, in our view, only modestly mispriced or trading near fair value. - Strategy design & risk controls (+15.7% return)
In creating the strategy, we explicitly decided to limit active bets other than value vs. growth. We implement constraints on individual position sizing as well as net sector, industry, country, and currency exposures, and balance market cap exposures across longs and shorts. While serving primarily as a risk control measure and a way to focus the portfolio on our top-down insights, these constraints have proven beneficial in a period in which certain industries (e.g., technology) and securities (e.g., the “Magnificent 7”) have been unusually dominant.
The forward-looking opportunity is strong
Despite excellent performance of the strategy thus far, value remains wonderfully cheap (top-decile relative to history). We estimate that value globally still needs to outperform growth by 60-70% for relative valuations to return to long-term averages. Our expectation is that decisions like the ones noted above will continue to benefit our portfolio above and beyond this beta opportunity. Consequently, at nearly 20%, Equity Dislocation remains the largest single exposure in our Benchmark-Free Allocation Strategy.
Download article here.
For the YTD period through 6/30/2024 specifically, Equity Dislocation rose 5.8% gross (4.7% net) while MSCI ACWI Value has trailed MSCI ACWI Growth by 10.1%.
This attribution is subjective; results depend on the order of operation and there is natural overlap between factors. Other factors primarily consist of trading and borrowing costs, but also include collateral and portfolio construction impacts. As of 6/30/2024, the collective contribution of this category has been -7.3% since inception.
Disclaimer: The views expressed are the views of the Asset Allocation through the period ending July 2024, and are subject to change at any time based on market and other conditions. This is not an offer or solicitation for the purchase or sale of any security and should not be construed as such. References to specific securities and issuers are for illustrative purposes only and are not intended to be, and should not be interpreted as, recommendations to purchase or sell such securities. Past performance is no guarantee of future results.
Copyright © 2024 by GMO LLC. All rights reserved.
For the YTD period through 6/30/2024 specifically, Equity Dislocation rose 5.8% gross (4.7% net) while MSCI ACWI Value has trailed MSCI ACWI Growth by 10.1%.
This attribution is subjective; results depend on the order of operation and there is natural overlap between factors. Other factors primarily consist of trading and borrowing costs, but also include collateral and portfolio construction impacts. As of 6/30/2024, the collective contribution of this category has been -7.3% since inception.