Deep value stocks are currently our highest conviction long-only investment idea. For the avoidance of any doubt, when we talk about “deep value,” we simply mean stocks that are cheap, often screamingly so, relative to our appraisal of their fair value. We do not care about a “growth” or “value” label that has been assigned, sometimes seemingly arbitrarily, by one index provider or another. Although a low price-to-earnings or other valuation multiple can certainly correlate with cheapness, such characteristics aren’t always present. Some low P/E stocks are worth even less than their prices, while some high P/E stocks warrant even bigger premiums. We target the cheapest 20% of stocks in comparison to their genuine fundamental worth, allowing for quality and potential growth, while avoiding deceptively cheap junky cyclical horrors and value traps.
In a world where many stocks are being driven ever higher by positive sentiment and investor optimism, many of the ones that have been most unloved and left behind are trading at extraordinary discounts. Of course, to see the full benefit of an investment in these stocks may require some patience, waiting for investor sentiment to unwind and valuations to reassert themselves. With that said, the recent performance of strategies we have created to take advantage of these opportunities has been surprisingly strong.
A Word on Performance
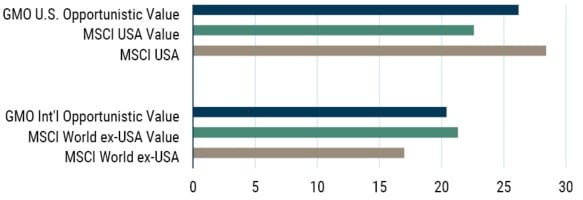
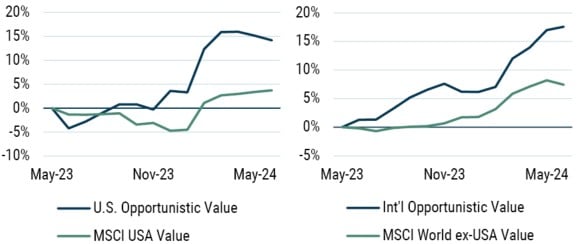
EXHIBIT 1: GMO INTERNATIONAL AND U.S. OPPORTUNISTIC VALUE STRATEGIES
Net Return (%)

Source: Bloomberg, GMO | Data from 5/31/2023 through 7/31/2024
For the 14 months from its inception on May 31, 2023 to July 31, 2024, the GMO International Opportunistic Value Strategy returned 20.8% p.a. net of fees, some 3.7% p.a. ahead of the MSCI World ex-USA Index and 54 bps behind the MSCI World ex-USA Value Index.
Against the broad market index, the strategy added value more or less equally across sector allocation and stock selection. Against the value index, the approach to stock selection was positive, but this was offset by modest relative underperformance in sector allocation. 1
For the same time period, the GMO U.S. Opportunistic Value Strategy returned 26.1% p.a. (net), which was 2.9% p.a. behind the MSCI USA (Gross) Index, but some 2.6% p.a. ahead of the MSCI USA Value (Gross) Index. In an environment where a handful of explosive growth stocks drove the broad market, the strategy was never realistically going to keep up. However, it was heartening to beat the MSCI USA Value (Gross) Index so decisively.
Many investors may want an exposure to global value, and this can easily be achieved by investing across the two strategies in the same proportion as the market cap of the U.S. and the market cap of the rest of the developed world. Perhaps unsurprisingly, given the underlying performance of the individual strategies, a market cap weighting of 70% U.S. Opportunistic Value and 30% International Opportunistic Value would have held up well relative to the MSCI World indices.
GMO Value Is Just Better
The starting point for any value-based investment approach is a view of the current fundamentals of each company, typically relying on metrics from accounting data. Unfortunately, several issues, such as inconsistent treatment of intangible assets and distortions from buybacks, have rendered accounting data unreliable for comparison at best, or useless at worst. 2 To rectify these issues, GMO painstakingly restates the financials of every company in the investable universe to properly reflect their current fundamentals and allow for fair and consistent comparison.
Having a better starting point is, of course, only half the battle, and must be complemented by an understanding of the future prospects of each company. We use a combination of models that consider factors like the quality of the company, corporate and management behaviors, along with an estimate of growth to form a view of true fundamental value.
Exhibit 2 shows how the restated GMO Book Value has grown for the portfolio holdings in comparison to the respective value index. The growth in forward book value for both strategies has far exceeded the indices, indicating the attempt to capture prospects as well as current fundamentals has proven successful. We believe this leaves the strategies relatively well positioned for the future.
EXHIBIT 2: GMO VALUE MODELS ARE BETTER AT ESTIMATING FUNDAMENTAL VALUE
1-Year Forward Economic Book Growth

As of 6/30/2024 | Source: MSCI, GMO
Series represent the portfolio-weighted one-year forward growth forecast in GMO’s Economic Book.
Forward Economic Book is calculated as current Economic Book plus one-year forward forecast retained earnings.
One striking example of the difference between GMO’s value approach and the more traditional value approach can be seen in the U.S. Communication Services sector.
EXHIBIT 3: COMMUNICATION SERVICES – 14 MONTHS TO 7/31/2024

Not only did the strategy successfully have an overweight to Communication Services, but it also achieved performance within the sector that was better than the market as a whole and far in excess of the value index constituents.
This is not an accident and highlights why we believe that an active approach to harvesting the massive discount that value stocks are trading at is far superior to a passive approach. While Alphabet and Meta, for example, are considered to be growth stocks by the MSCI index compilers, they are exactly the kind of bargains that we are looking to include in our deep value cohort and, indeed, they made a tremendous positive impact over the last 12 months.
Both Alphabet and Meta are highly profitable companies that score strongly on our quality metrics and yet trade at a significantly lower forward P/E ratio than the broad market. That is why our strategy will continue to focus on valuation and fundamentals when deciding if a stock is cheap or expensive and not be swayed by artificial labels.
Putting It Together – Global Value and the Opportunity
In a world with some markets sitting at or near all-time highs with elevated valuations, deep value offers compelling opportunities across regions. Deep value stocks are trading extremely cheaply relative to broad markets and their own history. In an expensive world, this combination leaves them positioned to deliver strong absolute and relative returns.
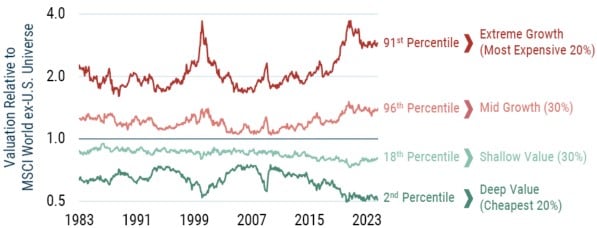
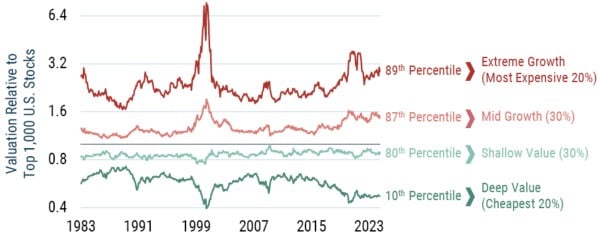
Outside of the U.S. all value is cheap, but deep value is in the 2nd percentile of its history. Within the U.S., deep value is similarly sitting at the 10th percentile of its history, while the rest of value should largely be ignorable at current valuations.
EXHIBIT 4: IN DEVELOPED MARKET EX-U.S., DEEP VALUE (CHEAPEST 20%) IS VERY CHEAP
Valuation Groups in MSCI World Ex-U.S. Universe

Preliminary as of 7/31/2024 | Source: GMO
Stock valuations are calculated on a blend of Price/Sales, Price/Gross Profit, Price/Book, and Price/Economic Book. Groups of value and market are weighted by square root of market cap. All groups have the same country exposure as the universe.
EXHIBIT 5: WITHIN THE U.S., DEEP VALUE (CHEAPEST 20%) IS TRULY DISLOCATED
Valuation Groups in Top 1,000 U.S. Stocks

Preliminary as of 7/31/2024 | Source: GMO
Stock valuations are calculated on a blend of Price/Sales, Price/Gross Profit, Price/Book, and Price/Economic Book. Groups of value and market are weighted by square root of market cap.
History shows that these valuation gaps shift through time, and mean reversion of spreads is a reliable and rewarding way to invest. Over the last year or so, it appears as if value is starting to outperform outside of the U.S. Meanwhile, the AI revolution and the dominance of mega-cap may have temporarily postponed the turn in the U.S., although July registered the first significant relative step back for growth.
We estimate that a full reversion to median historic relative valuations would need value to outperform growth by roughly 60%. Even absent mean reversion, at current valuations, value is positioned to handily outperform. 3
As an aside, it is important to note that the investor exuberance that has fuelled growth stocks in the U.S. has also done a tremendous job of driving valuations across the wider U.S. market (with the exception of deep value) to precarious levels. It is for this reason that our Asset Allocation strategies favor equities outside the U.S. in expectation of markedly higher medium-term returns.
Some investors may expect the dominance of U.S. growth to continue, but is it really necessary to take that position? The shifting dynamics across styles and geographies argue that now could be an excellent time to introduce some diversification.
Portfolio Fit
If you are asking yourself how your portfolio will perform when value roars back or when the U.S. market stumbles, then taking an exposure to global value with GMO could provide some peace of mind.
- GMO value is superior to naive or passive value as it assesses the true fundamental worth of companies rather than focusing on flawed accounting metrics or index provider labels.
- It has been a tough ride for value managers over the last decade – many have moved to a more core approach in an attempt to retain assets and survive the prolonged growth cycle. GMO’s Opportunistic Value Strategies are not weighed down by the baggage of past poor performance and thus remain free to truly target the very cheapest stocks.
- Value looks to have turned outside the U.S., so that may be the ideal place to look if you want to diversify geographical exposure away from the S&P 500. Indeed, the S&P 500 is tech and growth heavy, so an investment in international value is the perfect complement from more than just a regional perspective.
- On the other hand, if you do believe that the U.S. remains exceptional but are worried about precarious valuations, then establishing a position in U.S. deep value may be an appropriate fit.
For more information on GMO’s Opportunistic Value Strategies or to discuss these opportunities further, please contact your GMO representative.
The MSCI World ex-USA Value index has some very extreme sector positions, for example over 30% in Financials and under 2% in Information Technology (in comparison, the MSCI World ex-USA index has a little over 20% in Financials and a little under 10% in Information Technology). In truth, we are comfortable that the strategy has moderated some of these sector allocations a little bit.
For example, McDonald’s has a negative book value.
For more on this topic, see GMO's 3Q 2022 Quarterly Letter (Inker 2022).
*Net returns for individual components, such as sectors and countries, are calculated by applying the same fee rate that is used in the top level (total portfolio) net return calculation. Fees and expenses are not charged to individual investments, and net performance of individual components is provided for illustrative purposes only to meet regulatory requirements. Different calculation methodologies can result in materially different net returns for individual components. Please refer to the net performance of the Strategy, which best represents the net performance an investor would have received if they had been invested during the periods shown.
Disclaimer: The views expressed are the views of the Asset Allocation team through the period ending August 2024 and are subject to change at any time based on market and other conditions. This is not an offer or solicitation for the purchase or sale of any security and should not be construed as such. References to specific securities and issuers are for illustrative purposes only and are not intended to be, and should not be interpreted as, recommendations to purchase or sell such securities. Past performance is no guarantee of future results.
Copyright © 2024 by GMO LLC. All rights reserved.
The MSCI World ex-USA Value index has some very extreme sector positions, for example over 30% in Financials and under 2% in Information Technology (in comparison, the MSCI World ex-USA index has a little over 20% in Financials and a little under 10% in Information Technology). In truth, we are comfortable that the strategy has moderated some of these sector allocations a little bit.
For example, McDonald’s has a negative book value.
For more on this topic, see GMO's 3Q 2022 Quarterly Letter (Inker 2022).

