Published March 26, 2024
Trillions of dollars will be required to transition to a sustainable economy, and asset owners will inevitably need to deploy more capital into climate solutions to achieve their net-zero goals. Indeed, investing in climate solutions is part of a holistic and comprehensive approach to managing climate change risks. But strategies that focus on just one facet of climate change, namely emissions, may miss out on opportunities among “green” business activities, for example, companies that enable emissions reductions. But how does one identify and measure such activities across the global equity universe in a transparent and systematic way?
To answer this question, we began exploring the creation of a systematic, lower-cost, higher-capacity approach to investing in climate solutions in 2022.1 The brainchild of that research, the GMO Horizons Strategy, applies FTSE Russell’s Green Revenues Data Model2 to offer a core quantitative global equity solution to investors seeking to increase their exposure to climate opportunities and lower emissions. The resulting highly scalable strategy provides significant exposure to the upside potential of climate solutions using FTSE Russell’s data while controlling exposure to both direct and indirect emissions using GMO’s proprietary Indirect Emissions model.3 In this paper, we provide an overview of this green revenues model and share how the Horizons Strategy uses this data to provide a more comprehensive and impactful climate solution.
The Green Revenues Model
The FTSE Russell Green Revenues (GR) Data Model, launched in 2015, aims to assess the revenues of more than 16,000 securities. The GR model, which began with a taxonomy of business activities that mitigate and adapt to climate change, was broadened in 2020 to encompass other sustainability aspects such as water, resource use, pollution, and agricultural efficiency.
Using company disclosures, direct company engagement, and company- and sector-specific estimates, FTSE Russell conducts bottom-up assessments to determine the amount of “non-green” and “green” revenues for a given company. Green revenues are then classified into 10 sectors (see Exhibit 1) that are further broken down into 64 subsectors and 133 micro sectors.
Exhibit 1: Green Revenue Sectors
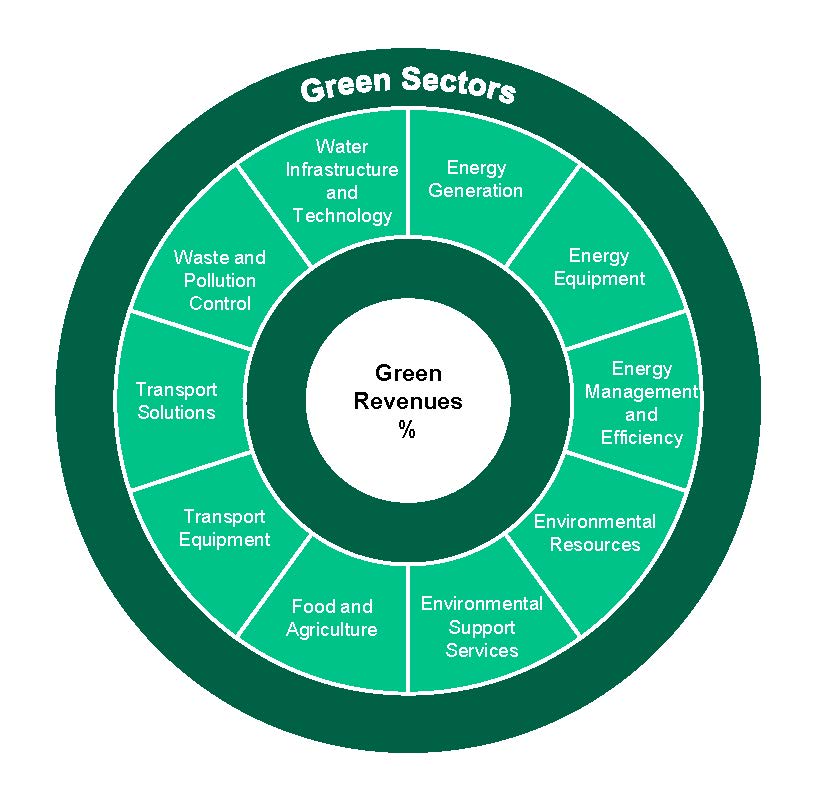
As of 2021 | Source: FTSE Russell
Magnitude of Impact
- Green revenues within the model are assigned tier ratings indicating the strength of their contribution to environmental objectives:
Tier 1 – Those activities with clear and significant benefits, e.g., waste to energy
Tier 2 – Activities with net positive benefits, e.g., organic byproducts to energy
Tier 3 – Activities with net neutral or negative benefits, e.g., grown biomass to energy
This tiering system allows us to incorporate more impactful green revenues in portfolio construction. The model requires more tier 1 revenue than tier 2, and more tier 2 revenue than tier 3. The Horizons model portfolio, for example, held weighted average tier 1, 2, and 3 green revenues of 15%, 11%, and 2%, respectively, as of year end.
In addition to providing a level of granularity and transparency that is not available from other data sets, the GR model offers superior insights on the strength and staying power of various green revenue sources. It also allows us to map green revenues to other finance taxonomies or sustainability goals.
Meeting Unique Sustainability Goals
The EU Taxonomy
The EU taxonomy, a widely referenced classification scheme to describe sustainable activities that contribute to the goals of the European Green Deal, came into law in July 2020. The regulation requires large EU companies to report on their alignment with this taxonomy and is therefore likely to prompt some investors to allocate their investments accordingly.
Though the GR model applied by Horizons targets a broader green revenue taxonomy than that of the EU (GR, for example, addresses additional environmental objectives such as waste management and pollution, while the EU taxonomy imposes very specific criteria for qualifying activities), the GR model’s granular and transparent approach offers us the flexibility to customize Horizons to expanded or alternative taxonomies, such as the Singapore-Asia taxonomy for sustainable finance. Holdings in the Horizons model portfolio had weighted average EU taxonomy-aligned revenues of 23% vs. weighted average green revenues of 28% at year end, for example.
Biodiversity and Nature-related Opportunities
Green revenues can also be mapped to biodiversity and nature-related objectives. The Taskforce on Nature-related Financial Disclosures, for instance, identified five broad areas for positive biodiversity impacts: 1) emissions reductions; 2) regeneration of environmental asset quality; 3) increases in quality and quantity of ecosystem service; 4) pollution removal, reduction, reuse, recycling, and transformation; and 5) invasive species removal. The table below outlines the GR micro sector categories that promote the sustainable use of natural resources and/or protect, restore, and regenerate the ecosystem.
Exhibit 2: GR Sectors That Contribute to Biodiversity Objectives
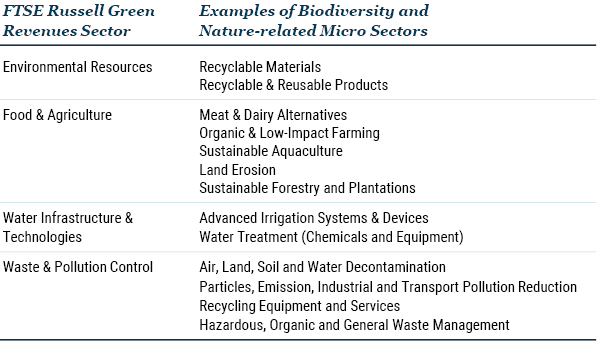
As of 2021 | Source: FTSE Russell, GMO, London Stock Exchange Group, Taskforce on Nature-related Financial Disclosures.
Exposure to biodiversity and nature-related activities can be as high as 91% for a few companies in the Horizons model portfolio, but the market exposure overall remains low with a weighted average of 1.1% for MSCI ACWI. The Horizons model portfolio provides about three times more exposure with an average 3.8% of biodiversity-related revenue.
Measuring Green Revenue Exposures
To measure a portfolio’s exposure to green revenues, the green revenues are aggregated across the portfolio by multiplying the proportion of a company’s green revenues by its portfolio weight. (We chose to define green companies using weighted average green revenue, or “WAGR,” rather than an arbitrary green revenue threshold.) Very few companies (less than 1% of MSCI ACWI constituents) have more than 50% green revenues, which means the portfolio would be very concentrated. Exhibit 3 shows the number of companies and market capitalization available at different green revenue thresholds.4 If you set a threshold of 10% green revenues (which is not a whole lot), your investment universe (based on MSCI ACWI) would comprise 514 issuers representing about 21% of the market cap.
Exhibit 3: Market Cap by Green Revenue Range
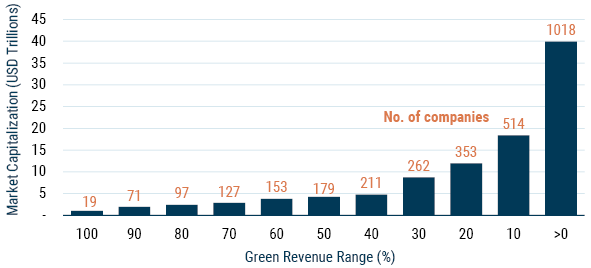
As of 12/29/2023 | Source: MSCI, FTSE Russell
Sustainable Opportunities Are Diverse
Climate solutions are often thought of as pureplay renewable energy and electric vehicles. In reality, however, sustainable opportunities span a diverse range of activities across value chains. For instance, energy management and efficiency have constituted at least a third of the green economy since 2016, driven by building and industry energy efficiency measures.
As Exhibit 4 demonstrates, companies with green revenues can be found across almost all MSCI ACWI sectors, with more predominance in high-impact sectors such as technology, industrials, energy, materials, and utilities. Notably, utilities and consumer discretionary companies tend to have higher levels of green revenues, on average.
Exhibit 4: Green Revenue by GICS Market Cap
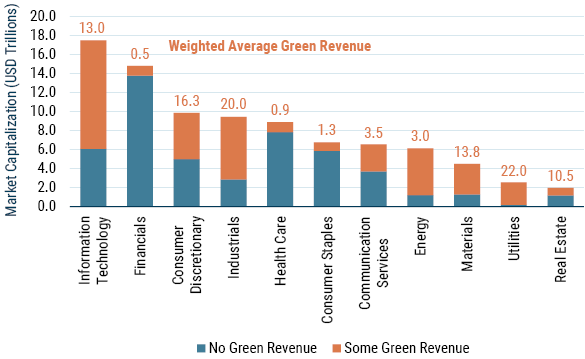
As of 12/29/2023 | Source: MSCI, FTSE Russell
By opting to use WAGR rather than a green threshold, the Horizons strategy has access to green revenues from all sectors of the economy, allowing us to build a more diversified, style-neutral portfolio. Furthermore, by using WAGR to measure rather than promote green companies, clients have much more transparency in terms of the magnitude of green opportunities captured by their portfolios.
Alternatives
The green revenue measures identified here capture products and services that exist today, but not necessarily those that are currently investing in new green products, research, and development. There are, however, forward-looking alternatives, such as “green capex” and “green patents.”
Green capex, or capital expenditures for new green equipment or green products and services development, capture activities that may have long lead times. The drawback is that companies do not typically provide a detailed breakdown of their capital expenditures as it relates to climate solutions.
Green patents, on the other hand, are a good indicator of companies’ innovation activities related to environmental technologies, thus signaling a company’s strategy for developing longer-term climate solutions. Still, they reflect only a subset of companies providing climate solutions in the market – not all climate solutions require innovation, not all climate inventions are patented, and not all patented climate technologies are implemented.
Since not all green capex and/or patents result in future revenues, our approach focuses on realized green revenue streams.
Conclusion
We expect to see increasing demand for comprehensive and customizable climate solutions as asset owners look to and achieve their net-zero objectives. As the world transitions to a lower carbon future, secular growth opportunities will be abundant up and down the value chain. We believe the GMO Horizons Strategy, by leveraging the FTSE Russell Green Revenue model in addition to our proprietary Indirect Emissions model, offers investors the power and flexibility to achieve a variety of net-zero and sustainability objectives in addition to strong risk-adjusted returns.
Download article here.